The southern California coastline is famed throughout the world, and Orange County (OC) is home to some of the region’s top beach destinations. From San Clemente in the south to Seal Beach in the north, there is a mix of wide sandy beaches and small cove beaches that attract millions of people every year from near and far. Locals cherish great surfing, quiet walks, and fun beach activities. Visitors flock to beaches to splash in the water and create unforgettable memories. Prior to the pandemic, tourism contributed nearly $10 billion per year to the OC economy.
Beaches serve another vital function: protection from damaging waves and rising seas. OC beaches defend railways, roadways, harbors, coastal wetlands, housing, and energy and water infrastructure. However, over the past century, the natural delivery of sand to the beach has been reduced, and several Orange County beaches are now experiencing severe erosion. What beaches will be threatened next, and how can beaches be preserved for future generations? The Metropolitan Beaches Project aims to address these questions by collecting data that can be used to study beach loss, understand drivers and inform management actions.
For nearly every decade since the 1920s, survey-grade aerial photo photography has been collected across southern California to document urban development and land use change. These aerial surveys qualitatively capture how the coast at different times over the past ~100 years, but to generate quantitative data useful for assessing trends, more detailed analysis is needed. In response, the 100 x 100 Project was created at the University of California, Irvine (UCI). A team of undergraduate Coastal Hazard Scholars digitized beach width every 100 m (~330 ft) along the coast for the past 100 years. What follows is a summary of the beach width trends that were observed.
Orange County Beaches: An Overview
Orange County was divided into three sections: South OC, Central OC, and North OC. South OC, which extends from San Onofre Beach to Doheny Beach, is characterized by continuous beaches and adjacent cliffs. Central OC, which extends from Dana Point to Corona del Mar, is characterized by cliffs and pocket beaches (semi-circular beaches flanked by rocks or cliffs). North OC, from Newport Beach to Seal Beach, spans lowland topography and has continuous beaches.
The figure below shows the 20th Century trends in beach widths resolved every 100 m along the coast:
green=increasing over time more than 0.25 m per year
red=decreasing over time more than -0.25 m per year
blue = less than +/-0.25 m per year change
A trend of 0.25 m/year is about the same as 10 inches/year.
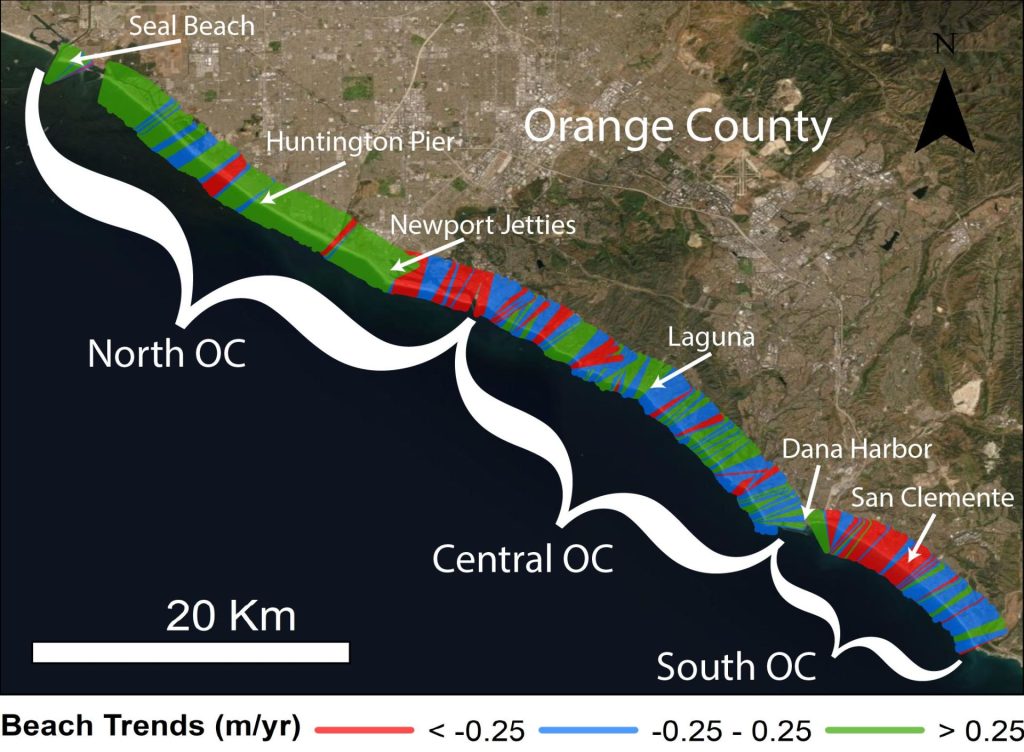
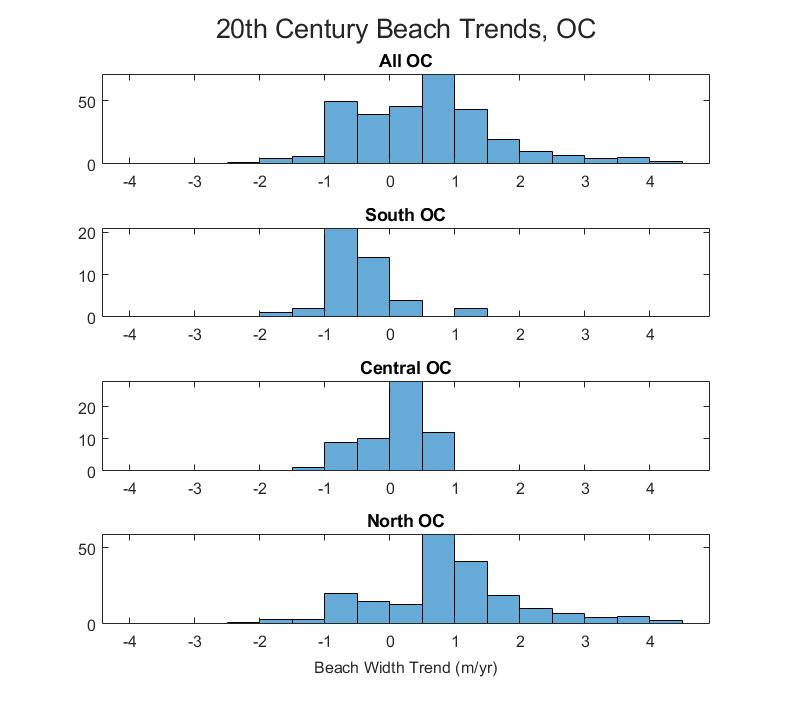
The distribution of 20th Century beach width trends across Orange County is shown in Figure 2, including separate distributions for the entire county (All OC), South OC, Central OC and North OC. These results show that, overall, far more OC beaches became wider in the 20th Century than became more narrow. Additionally, these results show a major contrast between South OC and North OC. In South OC, the vast majority of beach transects had a declining trend (negative) in beach width, while in the North OC, the vast majority of beach transects were had an increasing (positive) trend. In Central OC, there was a more even distribution between increasing and declining beach width trends, and magnitude of trends in Central OC was relatively small by comparison to beaches in North OC and South OC.
Next, we will take a closer look at a sample of beaches across the County, starting in South OC and ending in North OC. Aerial imagery used to measure beach width will be presented, alongside discussion about human and natural influences.
South County – San Clemente & Doheny Beach
SouthOC includes San Clemente, San Juan Capistrano, and Doheny Beaches. Many here have observed that beaches have been shrinking in recent decades, including sections of the Doheny parking lot that are crumbling away. These observations are aligned with data collected from our aerial imagery data, which suggest that beaches have steadily decreased since observations started in 1938.

Figure 3. Coastal erosion affecting parking lots and other infrastructure observed in Doheny Beach.
In the 20th century, the California coastline experienced exponential population growth and housing development. Images from the 1930s show that our coastline was relatively undeveloped with fields for agriculture and ranching, but by the 1940s and 1950s houses began to spring up right along the beach edge along with highways, parking lots, and residential tracts. These changes in infrastructure can be seen in the figure below which shows how San Clemente as changed from 1938 to 1990.
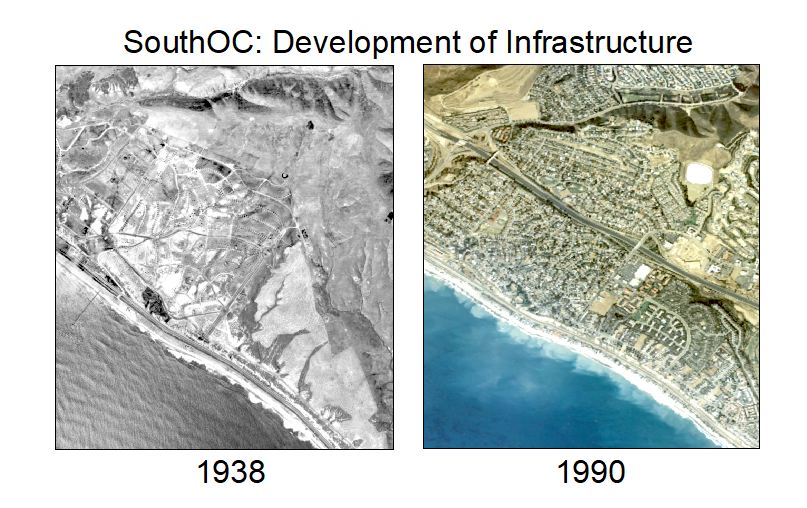
If we take a closer look along the beach, in 1938 we observe a relatively undeveloped coastline, except for Highway 1 running parallel to the coast. By 1990, however, housing occupied the backbeach.
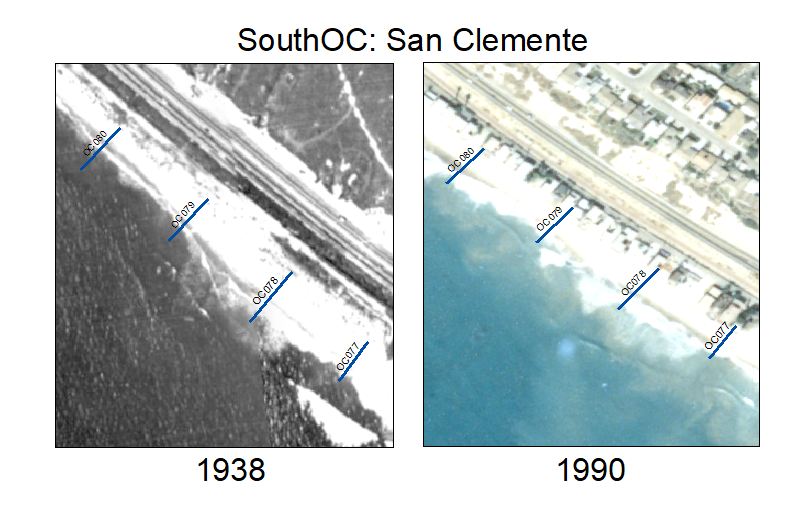
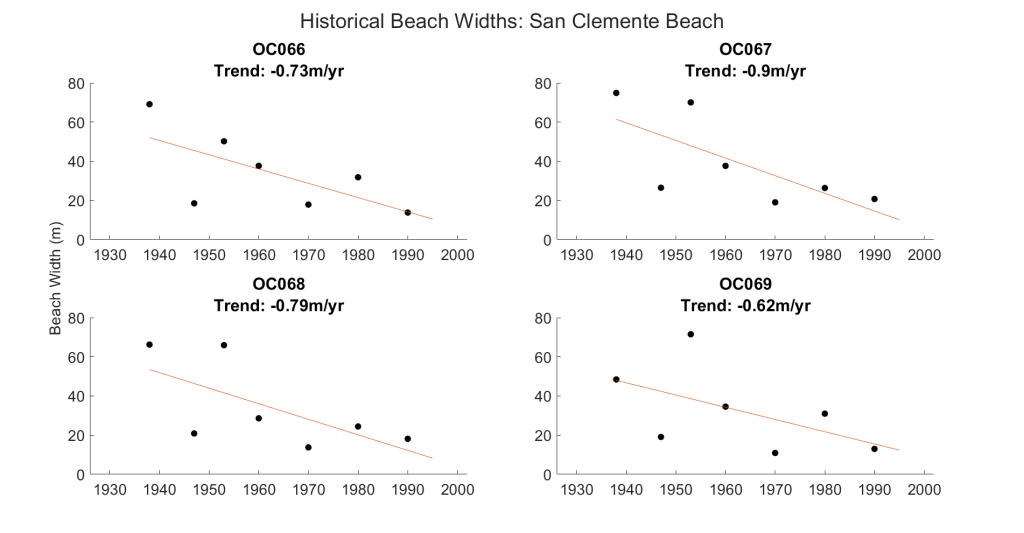
Beach width data over the last century reveals both short term gains and losses in beach width at San Clemente, but the overall trend is marked by a decline. For example, between stations OC066 and OC069 there was a beach loss trend of 0.7-0.9 m per year from 1938-1990. Beaches that were around 60 meters (nearly 200 feet) wide prior to 1940 were reduced in width to only 20 meters (65 feet) as of 1990.
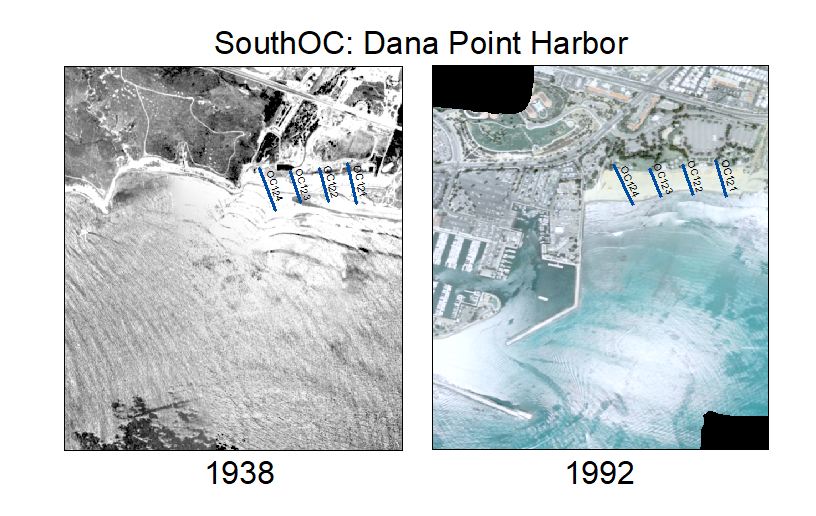
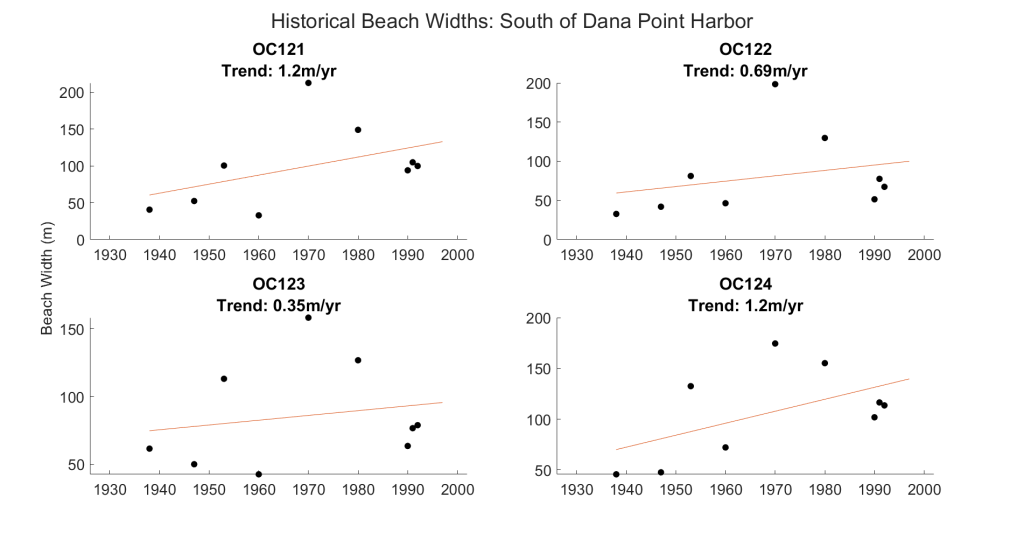
A major change to the South OC coastline was the construction of Dana Point Harbor in the 1960s, as shown in Figure 7. Here, beach width was a maximum in the early 1970s as shown in Figure 8, likely as a result of dredge material being used to widen beaches. Comparing beach widths from the peak in 1970s to more recent observations of 1990, there is a trend of declining beach width although beach width in the 1990s was wider than in 1938.
Central OC: Laguna Beach and other pocket beaches
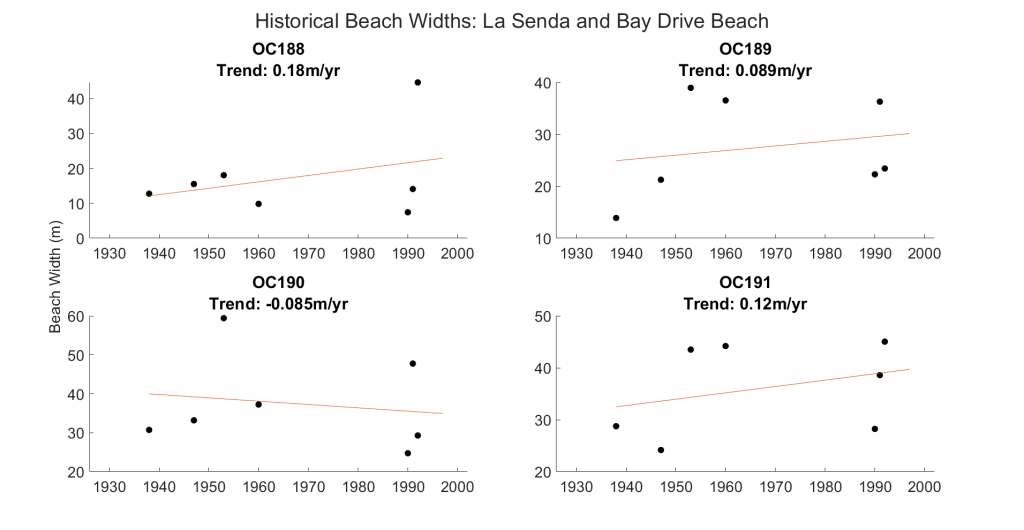
Central OC is marked by numerous “pocket beache.s” Pocket beaches are smaller beaches that lie between headlands or within coves. La Senda and Bay Drive Beaches, located in the southern part of Laguna Beach and shown in Figure 9 for 1938 and 1992, are examples of such pocket beaches. Major changes in landcover are clearly evident comparing 1938 and 1992, and notably a shift from agricultural land use to housing.
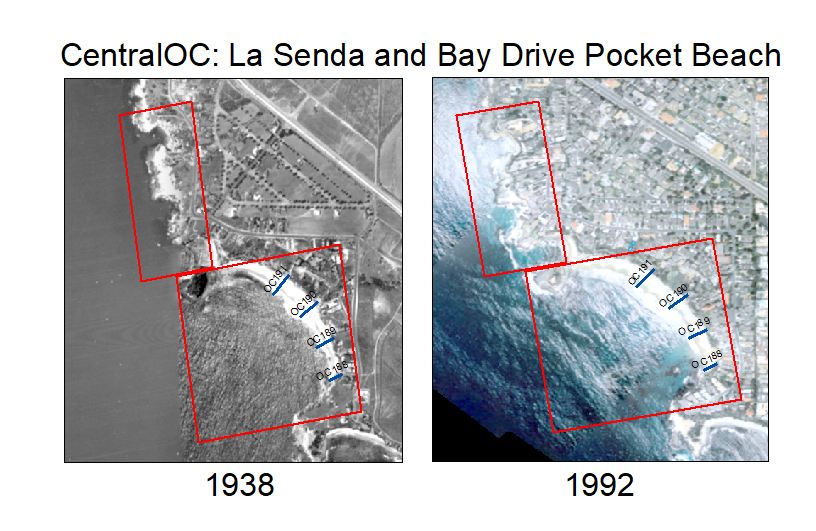
Pocket beaches are protected by headlands, which reduce the amount of sand that can travel in and out of the beach area. The timeseries of the region indicate that these beaches don’t demonstrate a strong trend in beach width, either positive or negative, during the 20th century.
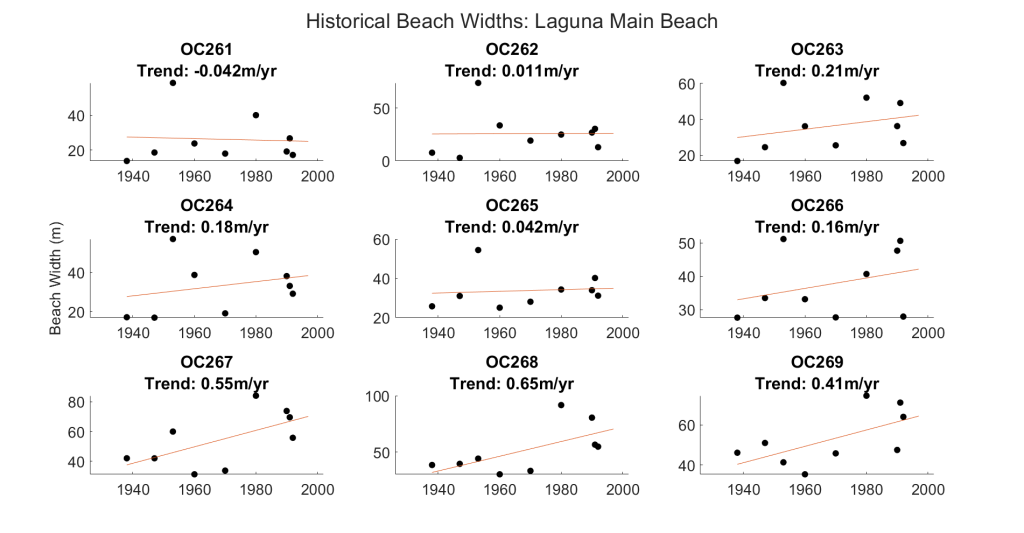
Main Beach is the largest beach in Laguna and is flanked by dense community development. Aerial imagery from 1938 (Figure 11) shows that the city center was substantially developed at that time.
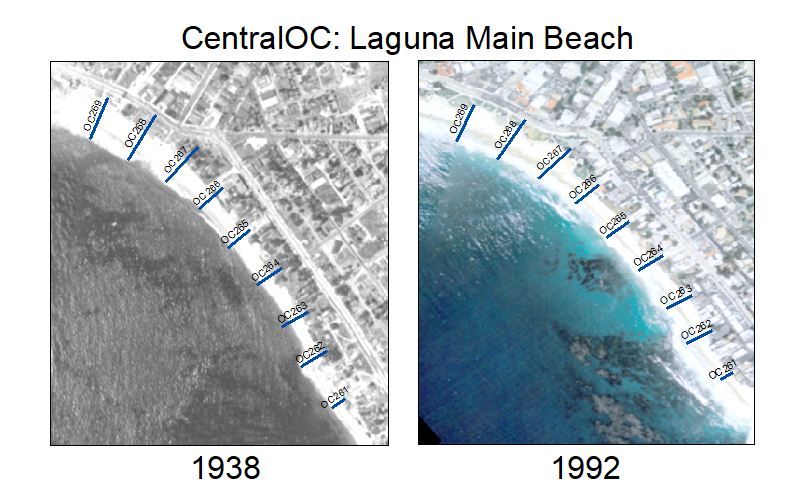
Main Beach in Laguna has remained stable, although a few transects show beach width increasing over time. Over the entire beach, there was an average increase of 0.79 feet (0.24 meters) a year.
North OC: Newport, Huntington, and Seal Beaches
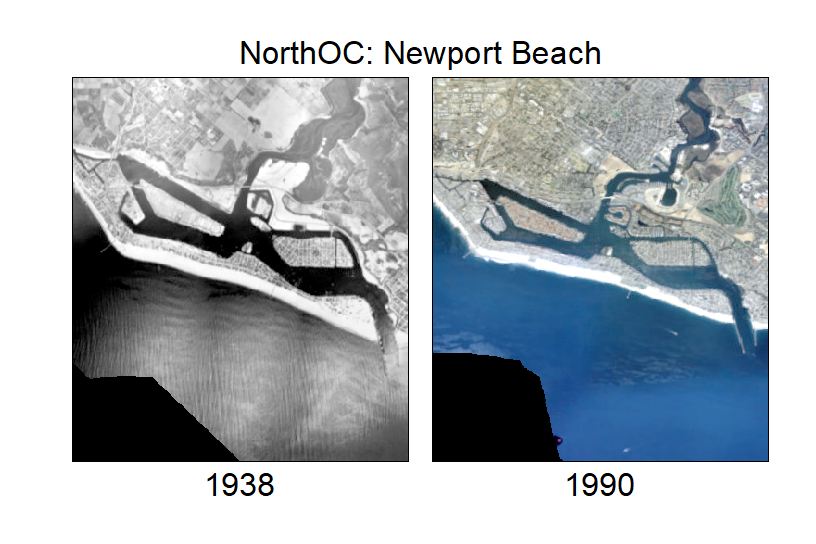
The North OC coast is marked relatively flat topography that was historically covered by salt marsh and the riparian wetlands of the Santa Ana River. This section of the coastline includes two piers, a boardwalk, expansive housing, large harbors, major energy infrastructure, major water infrastructure, and several marsh restoration areas including Talbert Marsh, Huntington Beach Wetlands, and Bolsa Chica Wetlands. When the first imagery was available for this analysis (1938), Newport Harbor and Balboa and Lido Islands were already constructed, and this resulted in a substantial widening of Newport Beach-with dredged material from the harbor placed along the open coast. Figure 13 below clearly shows that the south-facing beach along the Newport Peninsula was substantially wider in 1938 than in 1990. In contrast, the more western facing beach has grown in the same period.
A prominent feature along the west-facing beaches of Newport Beach are the Newport Jetties, which were constructed in the 1960s. A jetty is a structure of large rocks laid out perpendicular to the coastline to retain sand and stabilize a beach. Figure 14 below shows that west-facing beaches in Newport Beach were relatively narrow in 1927, and housing had encroached very close to the shoreline, while by 1991 the beach had widened substantially.
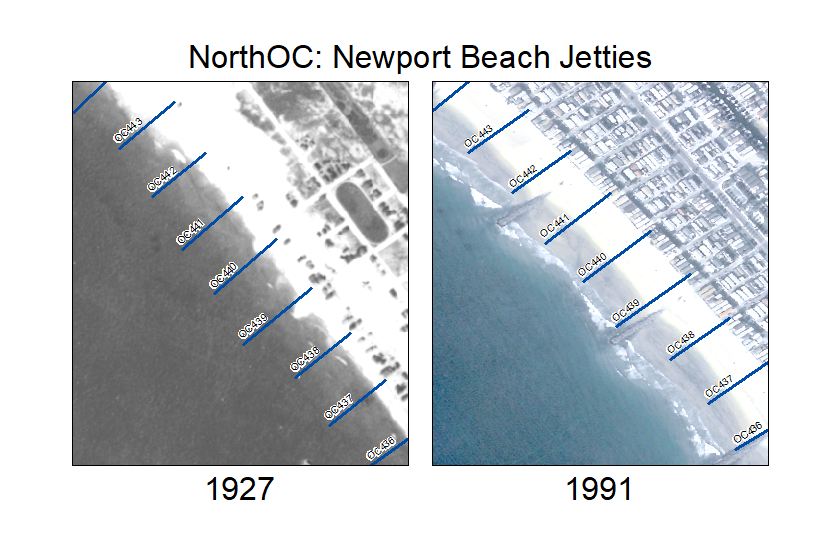
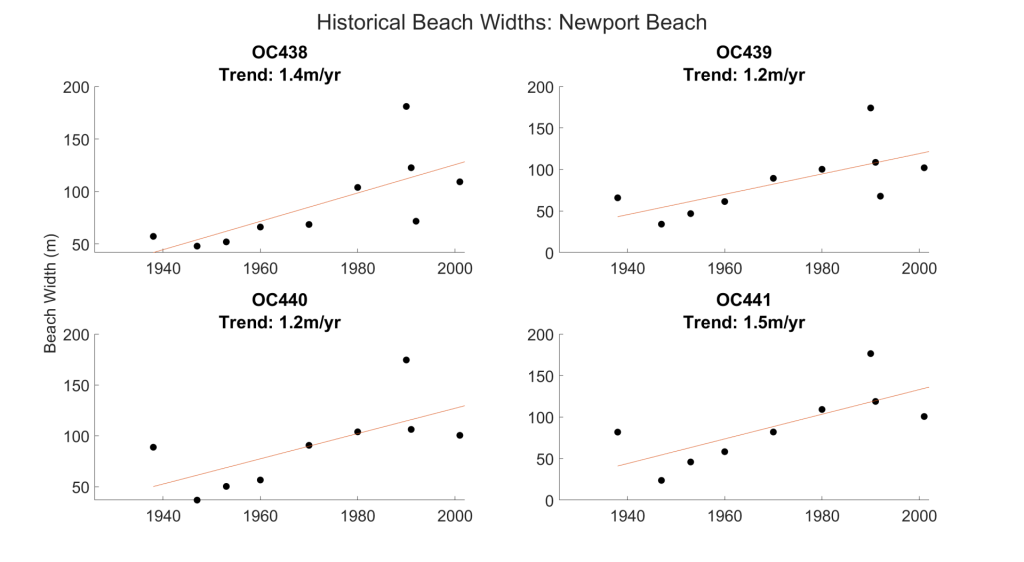
Stabilization of the beach followed construction of jetties. When looking at the beach width timeseries shown in Figure 15, it is clear that beach width was in decline or stable from the 1930s to the 1950s, but following construction of the jetties in the 1960s, beach width increased over time.
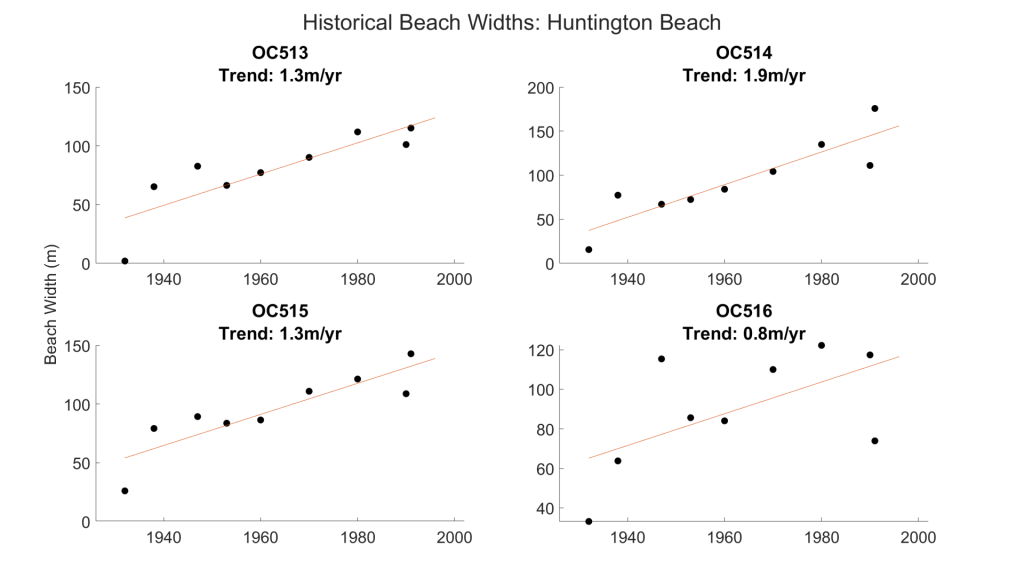
The second to last stop in this review of OC Beaches is Huntington Beach, nicknamed Surf City. An overview comparison between 1927 and 1991 shows that the area was already substantially developed by 1927 and the beaches have become wider over this period of time.
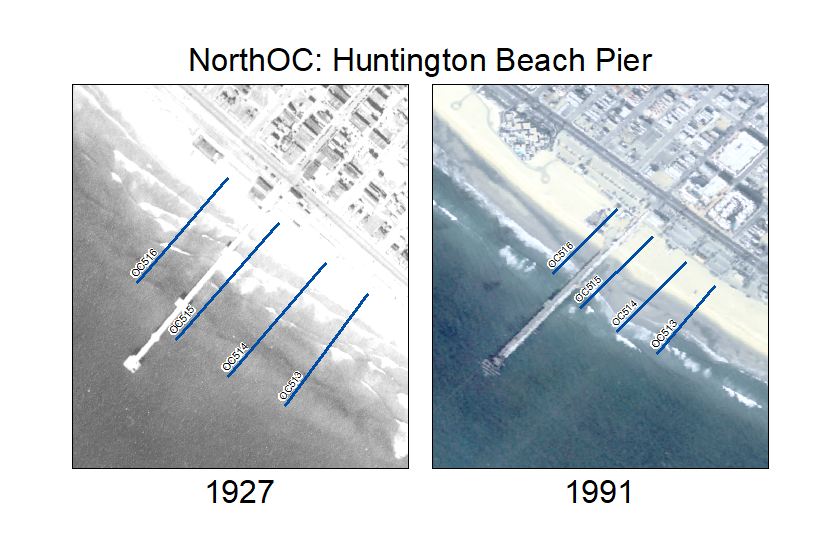
For the majority of Huntington Beach, average beach widths have increased over time-and at a high rate: beach width increased at rates of 1.5 to 2.0 meters per year which is some of the highest increases in beach width across the entire county. Between 1927 and 1991, beaches increased from 20 meters to over 140 meters in width!
The lone exception to a trend in beach widening around Huntington Beach is Patriot Point (also known as Dog Beach, section of Huntington Beach colored Red in Figure 1), where beach width decreased at a rate of 0.5 meters per year over the past 63 years.
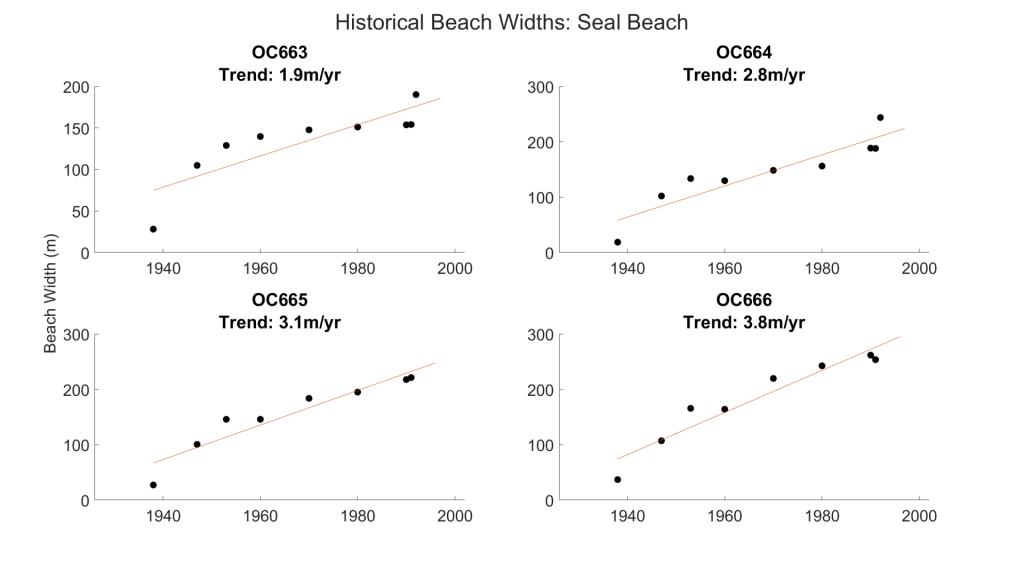
The final site discussed in this overview is Seal Beach, the northernmost beach in Orange County and one surrounded by numerous coastal structures such as jetties, seawalls, and breakwaters which affect wave characteristics and the movement of sand. A comparison of the beach in 1927 and 1991 shows that beach widths substantially increased on its northern-most edge, and that the face of the beach has changed from being oriented to the southwest (1927) to being oriented almost due south (1991).
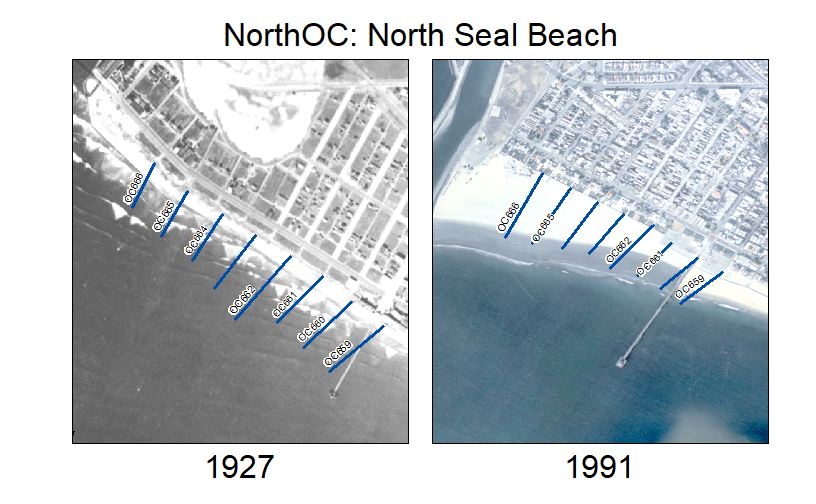
At the most northern edge, Seal Beach has increased in beach width at a rate at whopping rate of 4.5 meters per year (15 feet per year) between 1927 to 1991-the highest positive trend observed! Beaches only 50 meters wide in 1938 increased to nearly 300 meters wide in the 1990s.
Beach Nourishment
Beach nourishment refers to supply of sand to stabilize and enhance beach width. Sand can be supplied from rivers, harbors or offshore waters. It can be trucked, pumped, scooped, and/or moved by barges. Sometimes sand is placed directly on the top of the beach, while other times material is placed offshore with the intention of letting ocean waves push sand to the beach and wash away fine silt and clay particles to the deep ocean.
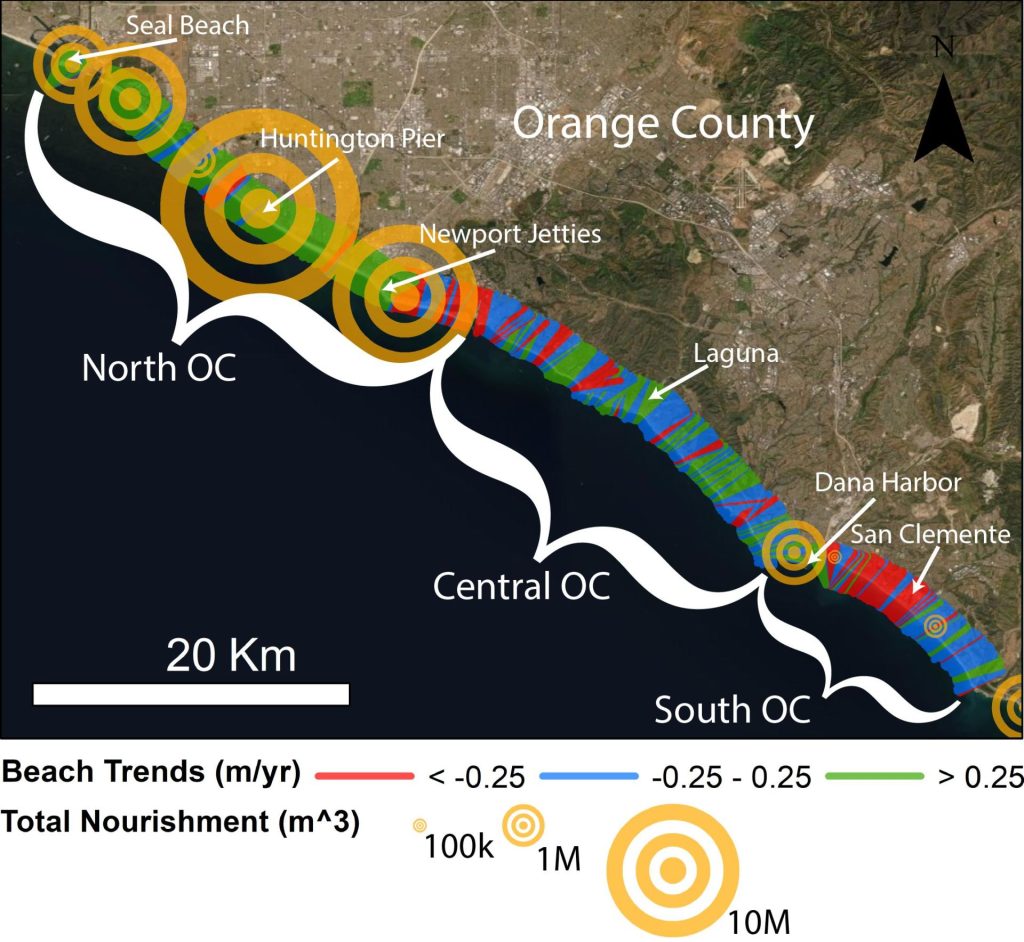
Many southern California beaches were artificially widened in the 1930s, 40s, 50s, and 60s from conversion of coastal marsh into ports and harbors. Sand taken from marshlands was used to widen beaches. There is also a practice of scraping up dry sediment from the Santa Ana River and placing it on Huntington and Newport Beaches, and there have been a variety of other nourishment projects in the region whereby sediments are dredged from offshore and/or harbors. A summary of all beach nourishment in the region based on the National Beach Nourishment Database is shown below in Figure 20, alongside 20th Century trends in beach width. This shows that the vast majority of beach nourishment across Orange County has been located in North OC, and Huntington Beach has received far more beach nourishment than any other beach in Orange County.
Summary
Historical aerial imagery of Southern California dating back to the 1920s support an examination of how the coast has evolved over time under human and natural influences. Human influences have been very strong: coastal marsh habitat dredged to make way for ports and harbors generated large volumes of sand that widened beaches, jetties and breakwater structures have redistributed wave energy and blocked sediment movement locally, while expansive development across the region has contributed to more recent sand starvation at the coast. Herein we present trends in 20th Century beach width extracted from the fit of a linear model to the observed beach widths.
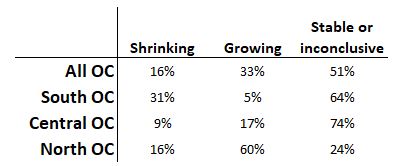
Taking an overview of Orange County, 51% of all transects analyzed remained relatively stable in the 20th century, while 33% have grown and 16% have had eroding trends. In South OC between Dana Point and San Onofre Beach, 31% of beach widths have been eroding while 64% have remained relatively stable and only a small fraction of beaches have grown. In Central OC between Data Point and Corona Del Mar, 74% of beaches have remained stable, with more beaches growing than shrinking if a trend was found. In North OC from Newport Beach to Seal Beach, 60% of transects have been growing while 24% have been relatively stable and 16% have shown erosive trends.
Beach nourishment data show that the North OC Beaches, and Huntington Beach in particular, is where the vast majority of beach nourishment projects have taken place. Hence, widening beaches is associated with a human-influenced sand supply. And conversely, beaches with declining width suffer from sand starvation most likely created by several other human-influenced factors: urban development that reduces the mobilization of sediment from watersheds, sand mining within flood control channels which reduces the amount of sand which reaches the coast, construction of coastal structures that alter wave-driven sediment transport, and armoring of cliffs and shorelines which reduces the supply of sediment from rainfall and wave runup. Human influences thus play a major role in both the widening and narrowing of beaches over the 20th Century.
Given the complexities, more detailed investigations than presented here are needed to develop solutions to beach loss. Nevertheless, having a historical knowledge of the coastline is crucial given the immense value of beaches to Orange County livelihoods, economic activity, resilience to climate change, and ecosystem health. So far in the 21st Century, we have witnessed an increase in the rate of sea level rise, and models projected that the rate of sea level rise will continue to increase. Higher sea levels are expected to increase the frequency of erosive wave events, and inundate low lying topography. More strategic management of sediment can help to strengthen the natural infrastructure we rely upon for a healthy and resilient coast, and strategic planning of infrastructure investments across the region are needed.
Contributors

Christine Parales Porciuncula | cporciun@bsanders
UCI Undergraduate Student, Department of Civil and Environmental Engineering

Rachel Devlin | cporci@yahoo.com
UCI Undergraduate Student, Department of Civil and Environmental Engineering

Daniel Kahl | dkahl1@uci.edu
UCI Ph.D. Student, Department of Civil and Environmental Engineering

2022 Coastal Hazard Scholars, Cohort 1