Seasonal and Inter-Annual Changes
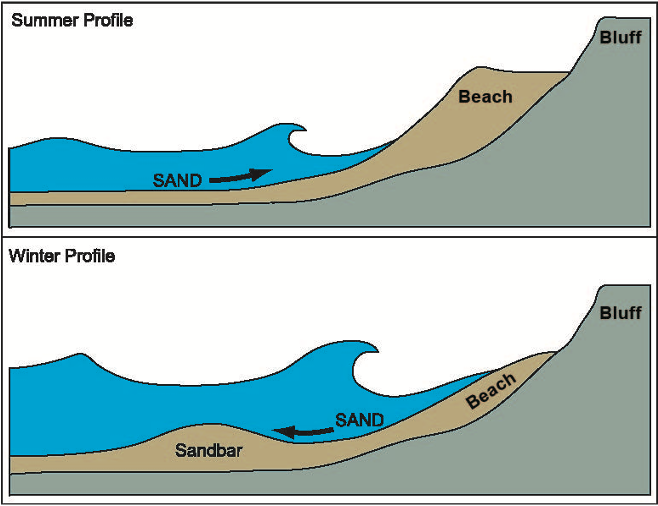
Beach width changes by the hour with the rise and fall of the tides and by energetic wave forces causing sediment movement. Beach width also varies seasonally in response to wave climate cycles. In southern California, beaches narrow over the winter months when waves are more energetic, then widen over the summer months when the wave climate is milder. When beaches narrow, sand is pulled offshore and typically forms a sand bar as shown below in Figure 1. This sandbar pushes the breaker line further offshore, causing wave energy to dissipate before reaching the upper beach and bluffs. Hence, the seasonal movement of sand between the beach and the sandbar constitutes an elegant balance of coastal self-protection. Moreover, an adequate supply of sand along the coast critical to this natural mechanism of shoreline protection.
To measure seasonal changes in beach width, imagery is needed on a monthly or even weekly basis – a requirement that is met by satellite-based imagery. In particular, the NASA/USGS Landsat Program provides imagery of the earth surface at 30 m dating back to the 1980s, and more recently Sentinel Program from the European Space Agency provides imagery at 10 m resolution since 2015. Images are generally acquired a couple of times every month, although only a subset of the images are useful due to cloud cover.


Once imagery is acquired, measurement of beach width proceeds by image processing. First, CoastSat software and Google Earth Engine are applied to extract the position of the shoreline. Second, the inland limit of the beach (back-beach line) is established from reference images. And third, the width of the beach is computed as the distance along a shoreline-perpendicular transect between the shoreline and the back-beach line.
A major advantage of using satellite imagery is that every image is time-stamped, which makes a tidal correction possible based on the slope of the beach. For this study, beach slope is computed from a LiDAR Digital Elevation Model (DEM). Furthermore, beach width is analyzed before an after a sand replenishment project to document the overall response of the shoreline between the Santa Ana River and the Newport Harbor mouth.
Analysis of Newport Beach
A sand replenishment project occurred in 2017 whereby sediment was placed within the West Newport groin field, as shown in Figure 3 (right panel). To monitor the shoreline response, shore-normal transects were established every 100 m along transects established by the Coastal Data Information Program (CDIP) Monitoring and Prediction (MOP) program, as shown in Figure 3 (left panel). This includes two West-facing transects (OC443 and OC462) and two South-facing transects (OC413 and OC 423). Furthermore, one of the West-facing transects (OC443) is in the vicinity of sand replenishment also shown in Figure 2 (right panel). Beach width was defined for each transect based on the distance between the beach/water interface (measured by Coastsat) and a back-beach line (measured manually) corresponding to hardened infrastructure including parking lots, pathways, and private land parcels.

Beach width anomalies (differences from the mean value) at Newport Beach estimated from Landsat 8 and Sentinel 2 imagery acquired between 2013 and 2020 are shown below in Figure 4.
Figure 4 shows that the 2017 sand replenishment project lead to a step-wise increase in beach width at the nourishment site (OC443), followed by a subsequent decline, and may have also contributed to a trend of increasing beach width at South facing beaches (OC413 and OC423) between 2017 and 2020. Satellite imagery also documents the seasonal changes in beach width shown in Figure 1. It is observed that South-facing beaches exhibit a seasonal variability in beach with of approximately 40 m while the West-facing beach near the Santa Ana River (OC462) exhibits approximately 60 m in seasonal variability and there is no obvious seasonal variability in beach widteh within the groin field (OC443).