Pre-Development Coastline
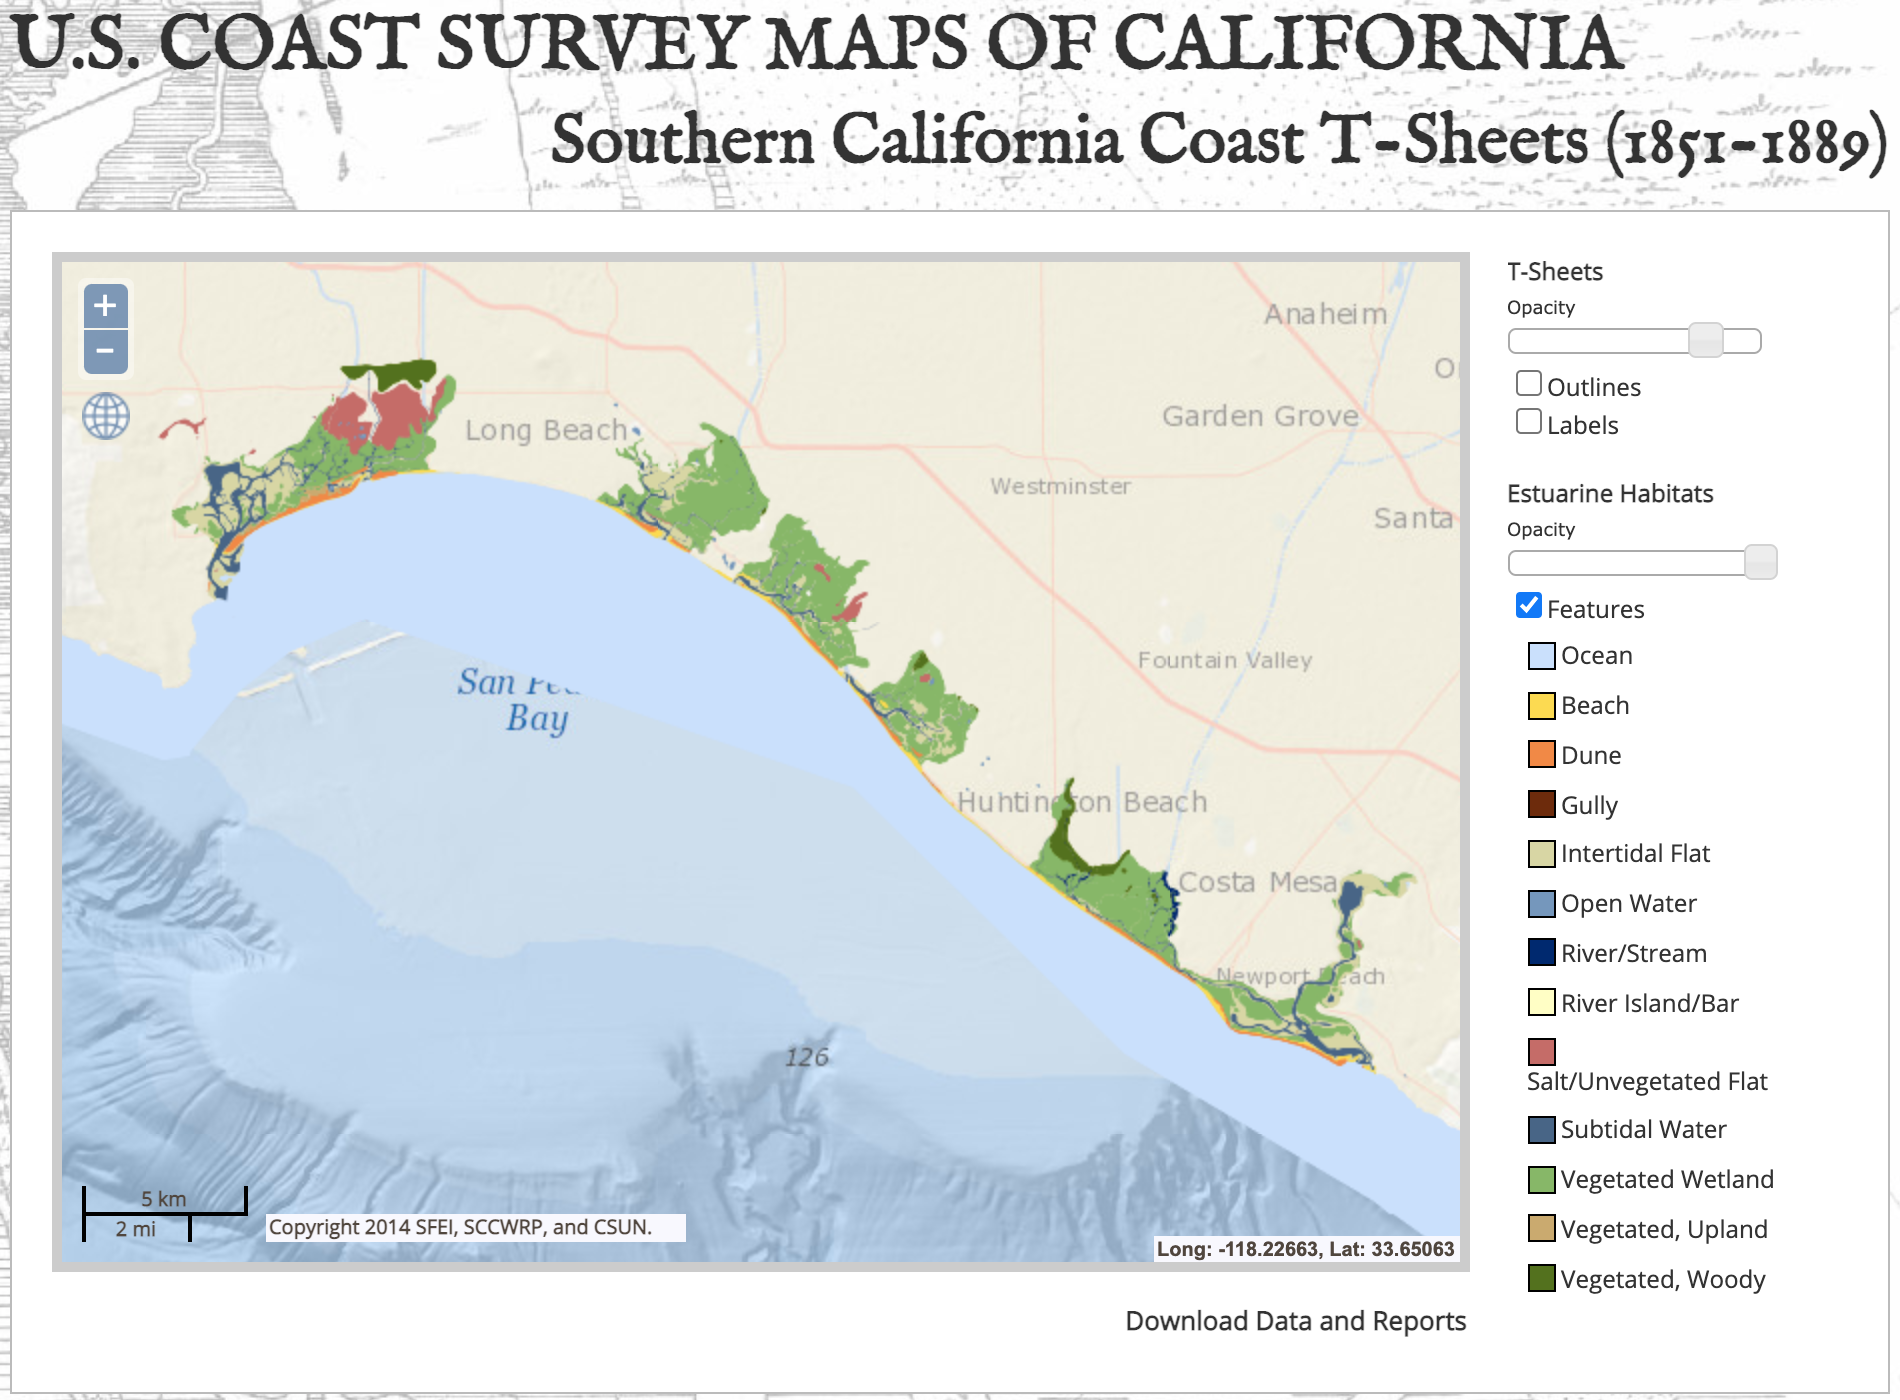
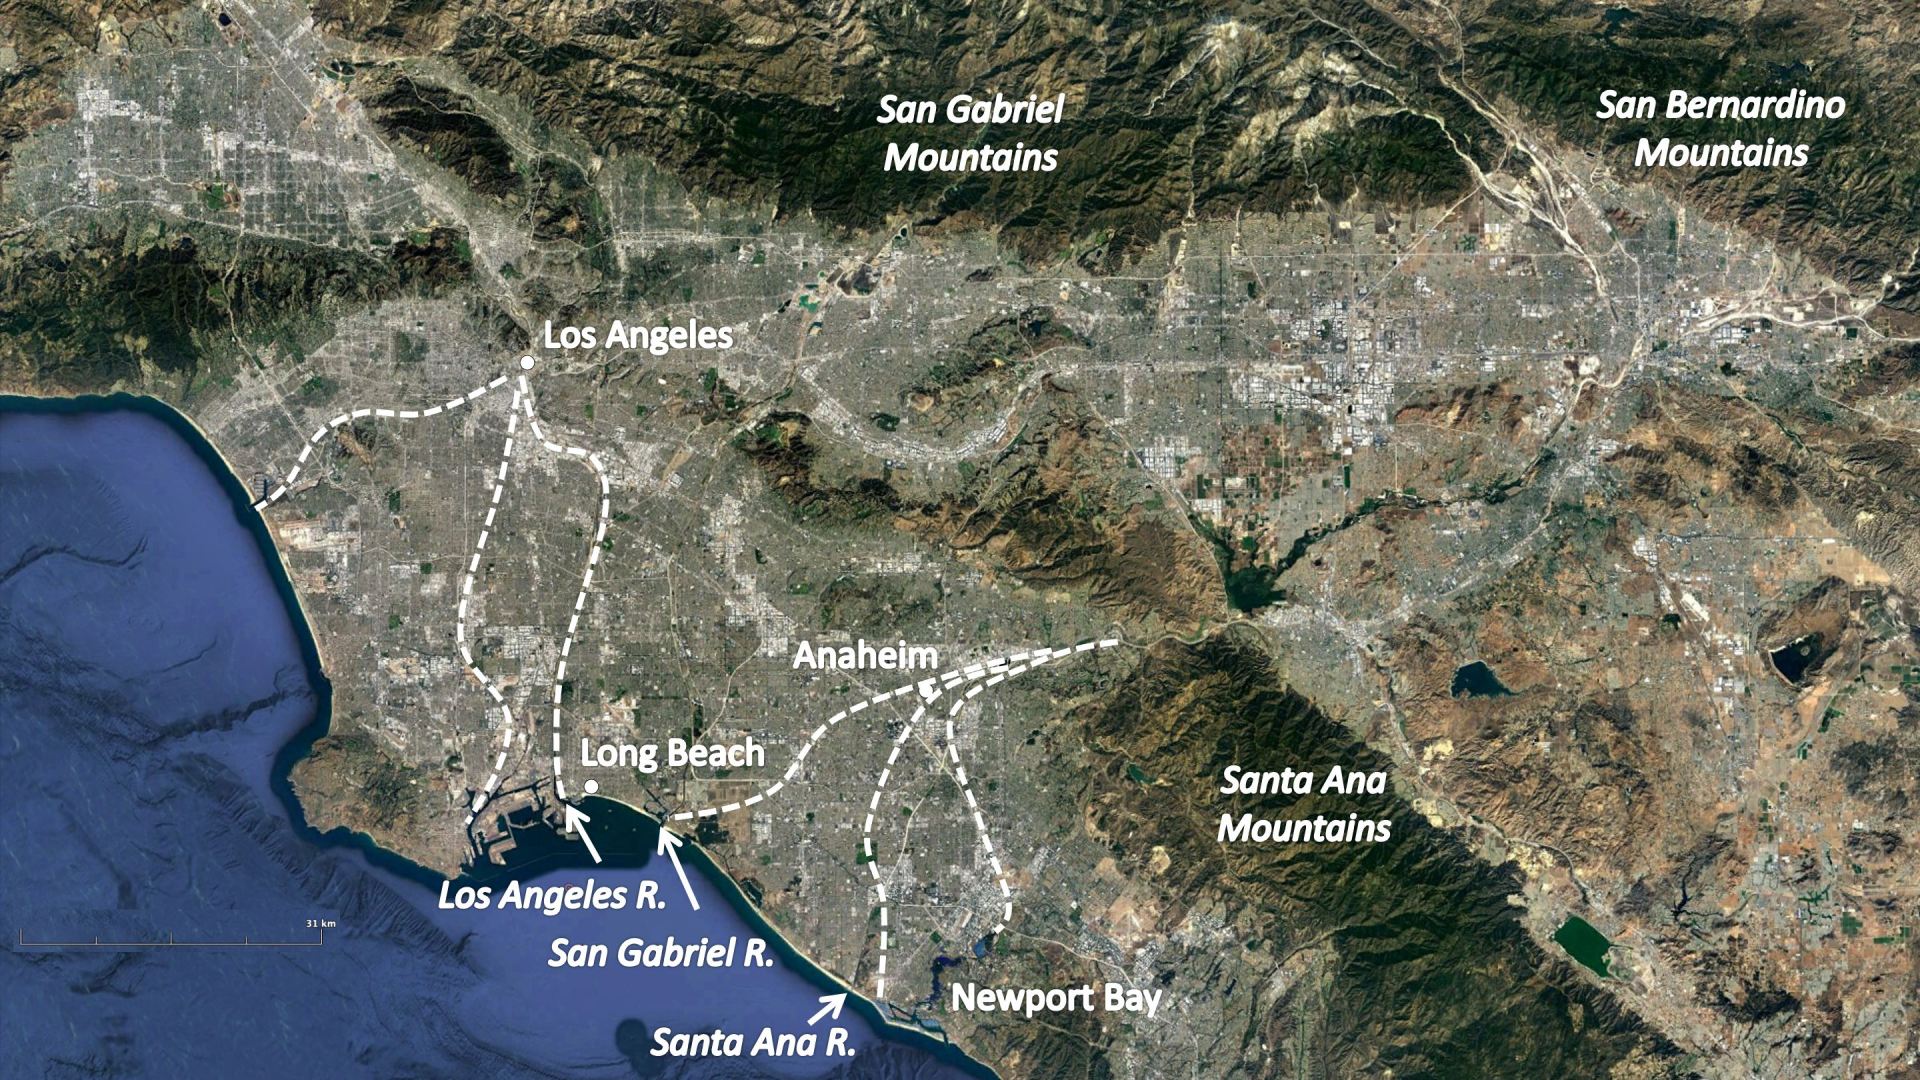
Southern California did not have its iconic expansive beaches prior to human settlement. The northern part of the Orange County coastline was characterized by coastal lowlands filled with marshes that would be episodically inundated with flood water from the Los Angeles, San Gabriel and Santa Ana rivers and also salt water from high tides and coastal wave events. Figure 1 (left) shows the distribution of coastal habitats from the time period 1851-1889 based on U.S. Coast Survey Maps (T-Sheets), and Figure 1 (right) shows flow pathways of the Los Angeles and Santa Ana Rivers. Along the coast, there were relatively small beaches along with vegetated dunes that sheltered the marshlands from the erosive forces of wave action from the Pacific Ocean. Beaches were supplied with sand episodically by major floods, while persistent wave action worked to redistribute sand along the coast – mainly from north to south in what is called the San Pedro littoral cell.
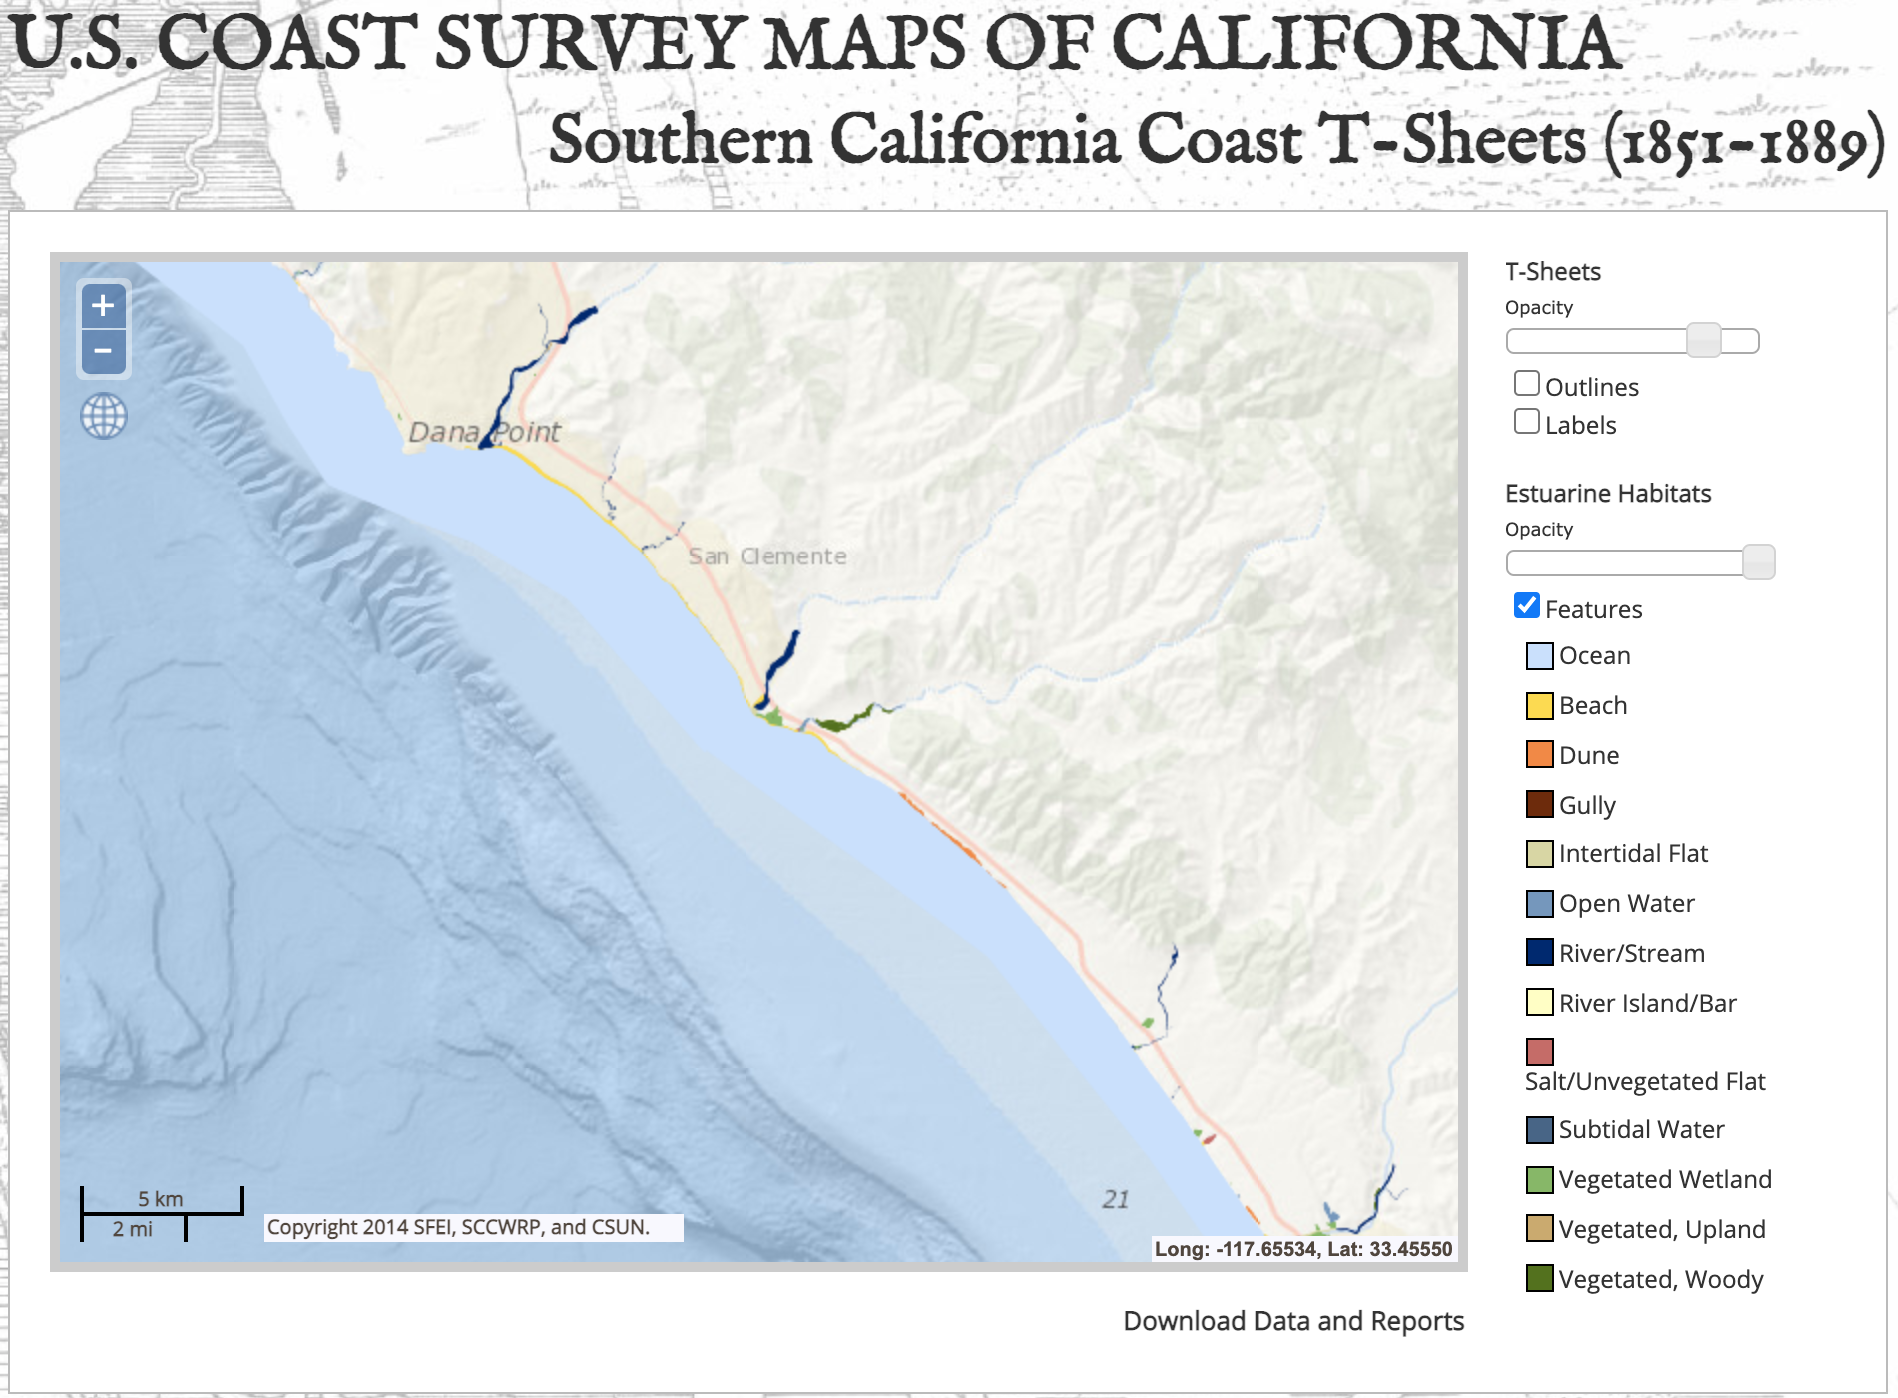
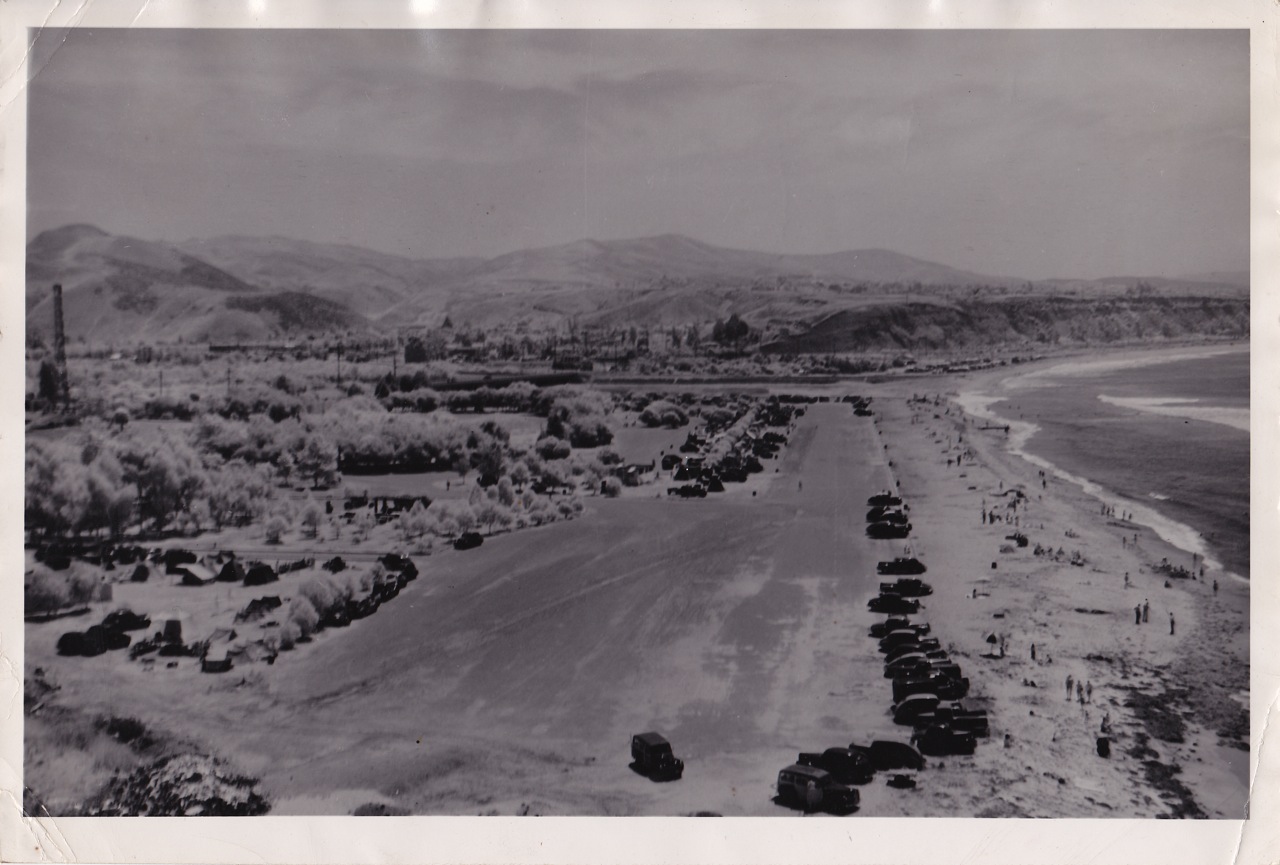
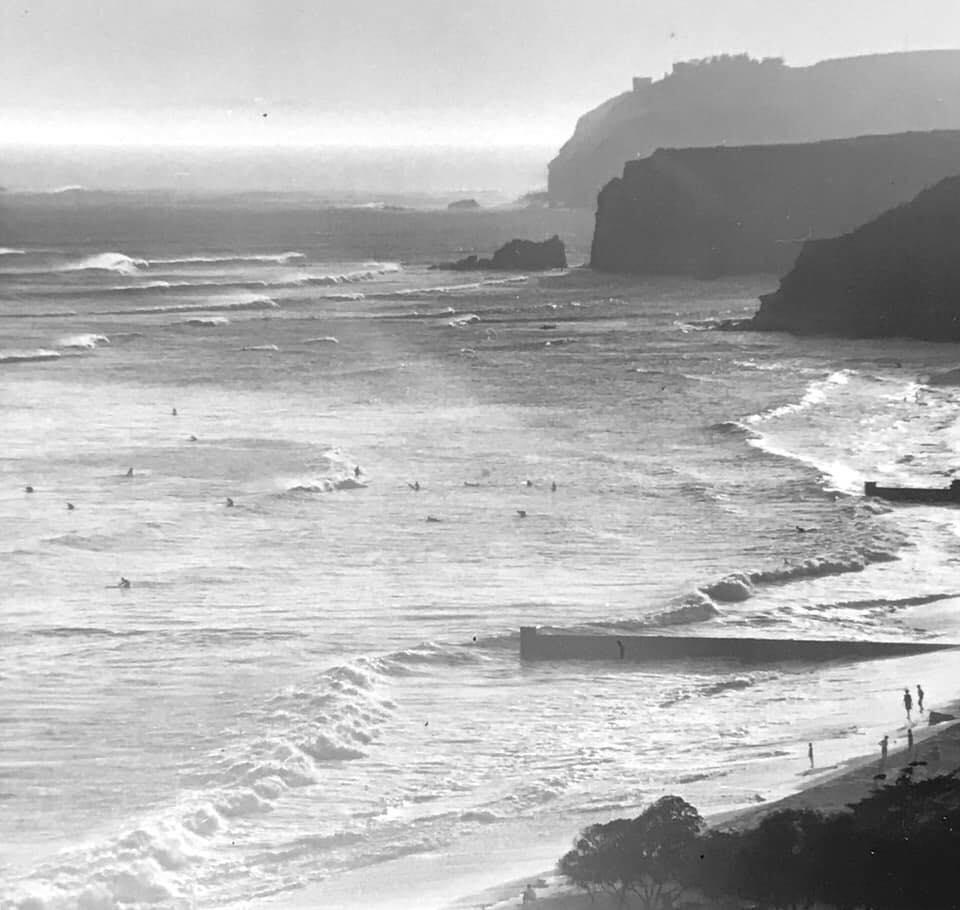
The southern part of the Orange County coastline is characterized by uplifting marine terraces cut by wave action, and did not expansive marshlands like the northern part of Orange County (Figure 2, left). However, there was a large natural beach at what is now Doheny Beach (Figure 2, right).

Doheny Beach was supplied with sands by San Juan Creek (Figure 3, left) and by cliff erosion (Figure 3, right). Cliff erosion is caused by a combination of wave-drive erosion at the toe and rain-driven sheet and rill erosion (i.e., from runoff over the cliff).
Sediments supplied to the coast south of Dana Point are generally worked south by wave action in what is called the Oceanside littoral cell, although sediment can also be moved north along the coast by waves from the south and southwest.
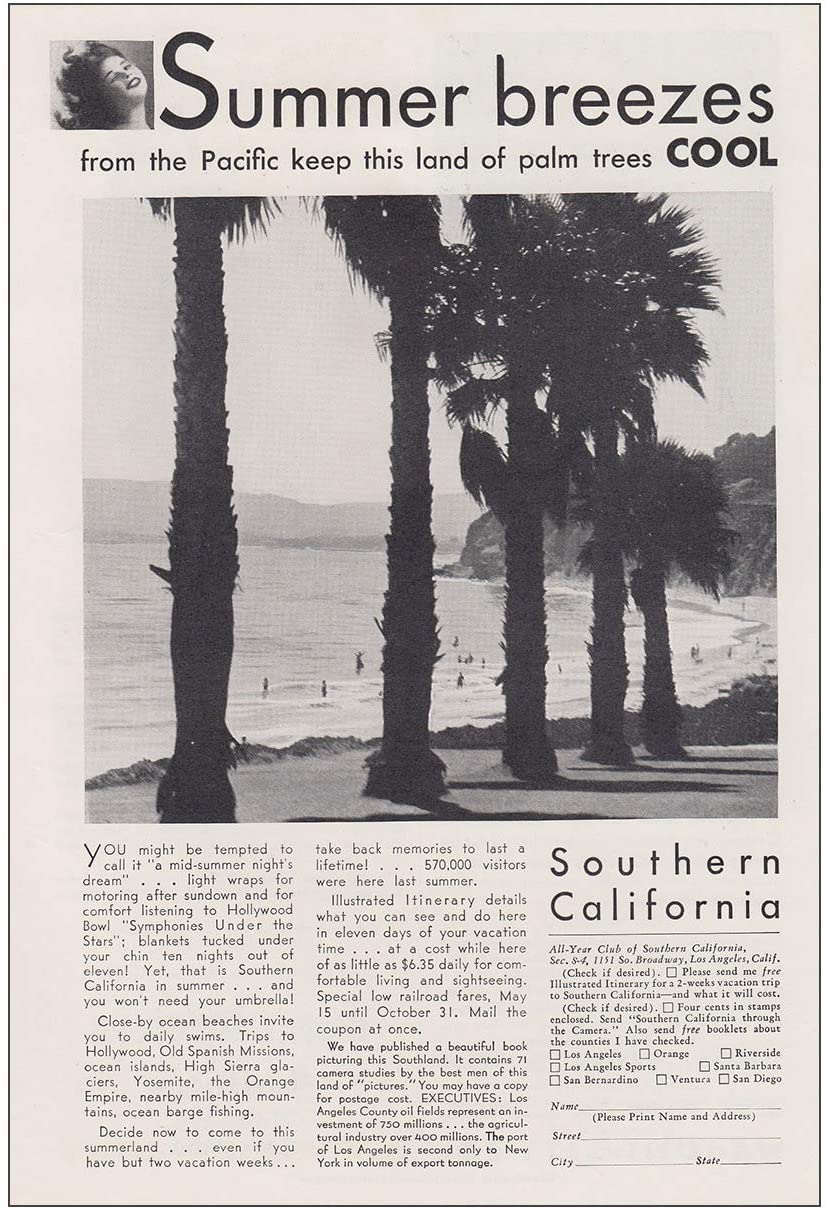
Economic Growth and Tourism
In the 1930s and 40s, economic development including the construction of ports and harbors and promotion of tourism aligned to opportunistically widen beaches in both northern Orange County. This greatly contributed to southern California’s iconic identity for a beach-oriented lifestyle, and systematically eliminated much of the natural coastal wetland habitat. In the 1960s, 70s and 80s, parts of the southern Orange County coastline were also widened from coastal development projects such as the construction of Dana Point Harbor and the San Onofre Nuclear Generating Station (SONGS).
Sediment Placement and Beach Nourishment
Sediment has been placed at beaches all across the northern Orange County coastline from the 1930s until today, as shown below in Figure 5. While sediment placement in the 1930s, 40s and 50s here was largely a consequence of harbor construction (and destruction of coastal marshlands), placement projects since that time have resulted from a combination of harbor dredging for navigation, river channel dredging for flood protection and interest in maintaining width for recreational and coastal flood protection needs. Placed sediment generally migrates downcoast from Sunset Beach to Newport Beach, and the Surfside-Sunset project in particular has been implemented to benefit all beaches downcoast to Newport Beach.

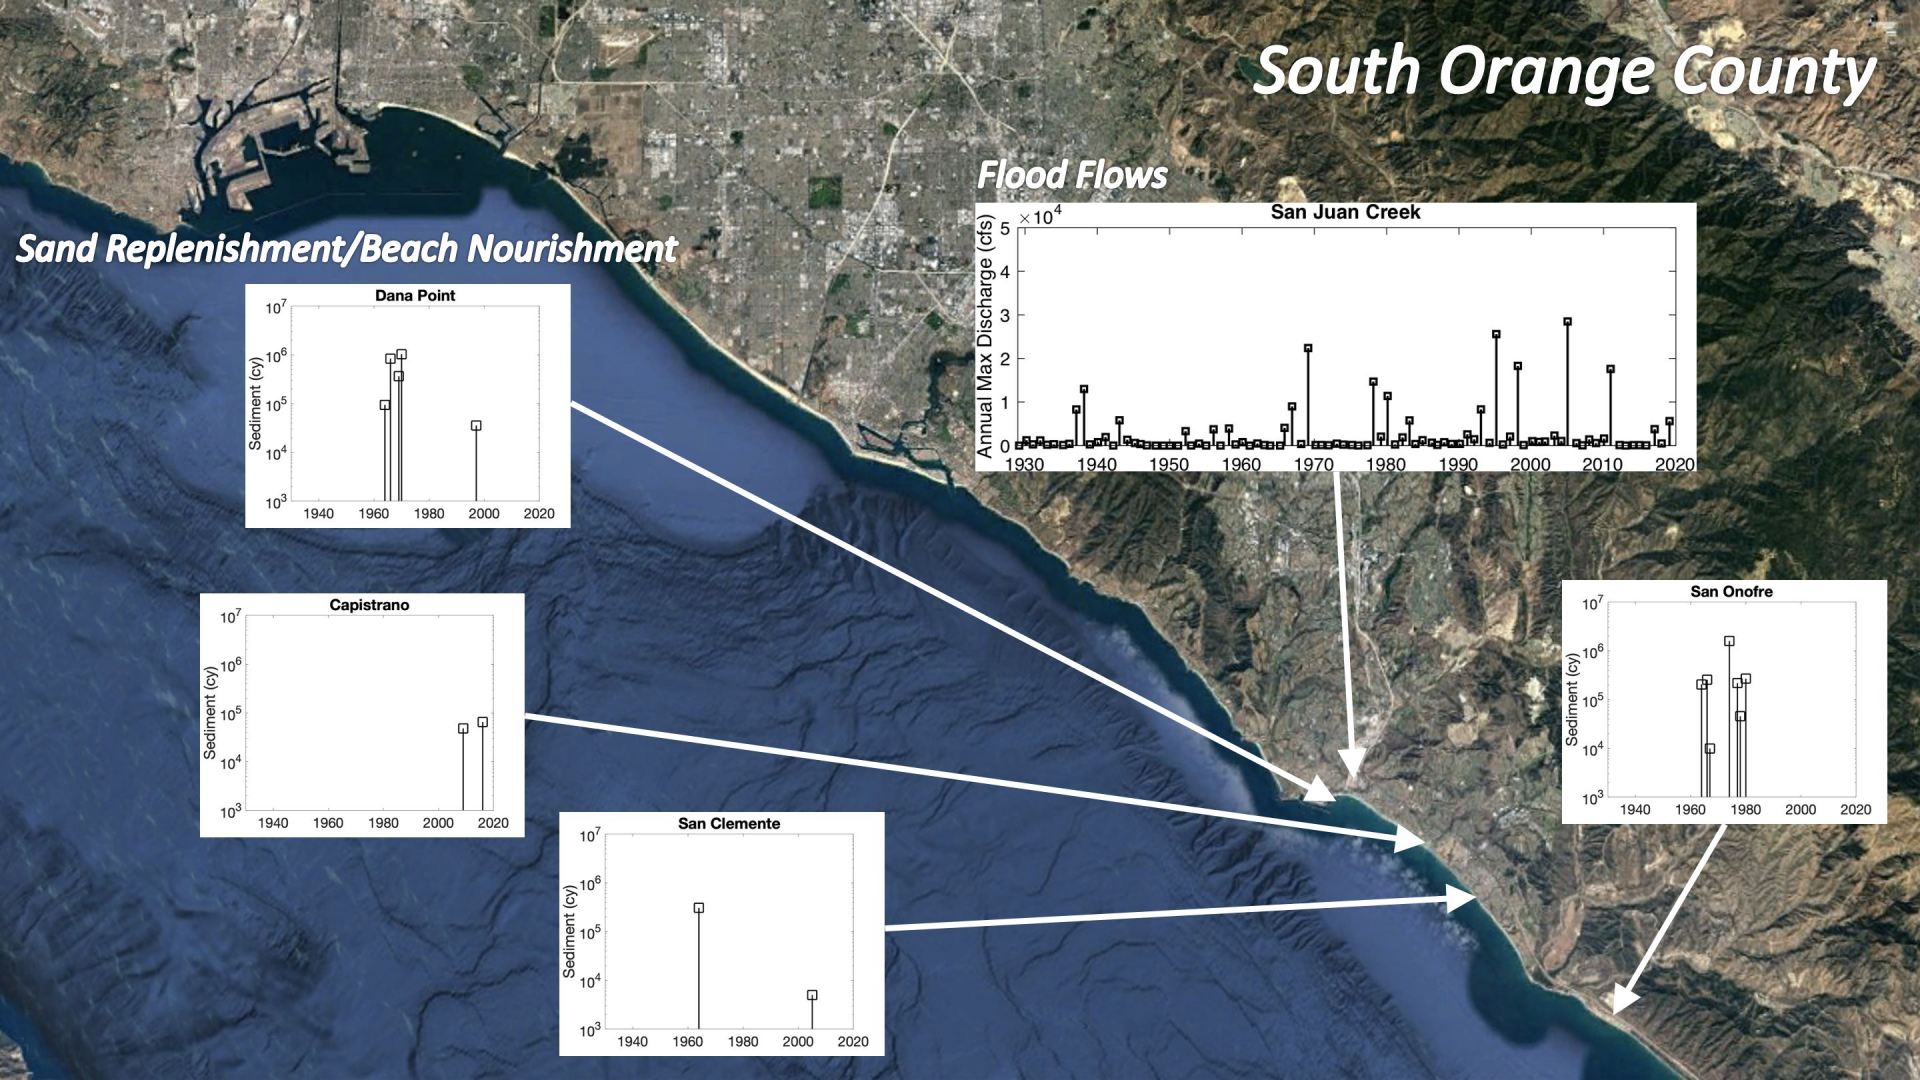
Across southern Orange County coastline, the volumes of placed sediment have been small compared to northern Orange County. Sediment placement did not commence until the 1960s with the construction of Dana Point Harbor and the San Onofre Nuclear Generating Station (SONGS) at San Onofre Beach. Furthermore, the nourishment of sediment to southern Orange County beaches has been minimal since the 1980s. We also note that there have not been any major floods in San Juan Creek to deliver sediment since 2011, and that the expansive development across southern Orange County over the past two decades has likely reduced the watershed delivery of sediment to the coast.
Beach Ratings Based on Recent Trends in Beach Width
In Summer of 2019, high school students Jenna Kim and Gwen Sanders completed a study of recent beach trends across Orange County beaches based on roughly 20 years of historical aerial and satellite imagery available through Google Earth. They also developed a beach rating system to highlight beaches that appeared stable (green), beaches showing possible decline in size (yellow) and beaches showing significant decline in width (red).
Figure 7: 2019 Orange County Beach Rating based on 20 years of aerial imagery.
This work clearly showed concerning trends in beach with at Sunset Beach in Huntington Beach, California and at Doheny Beach and Capistrano Beach in Dana Point, California. Sunset Beach is used as a “feeder” beach for beach nourishment projects: sediment dredged from offshore sites is pumped here on occasion and waves are relied up on to move sediment southeast towards Huntington and Newport Beaches. Moreover, there has not been a significant nourishment project here since around 2010.
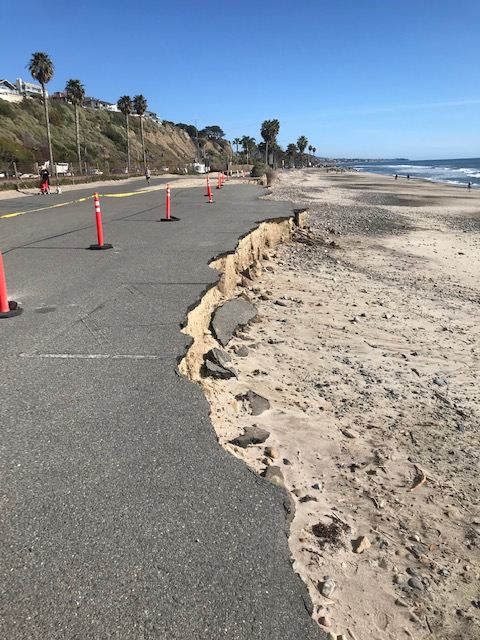
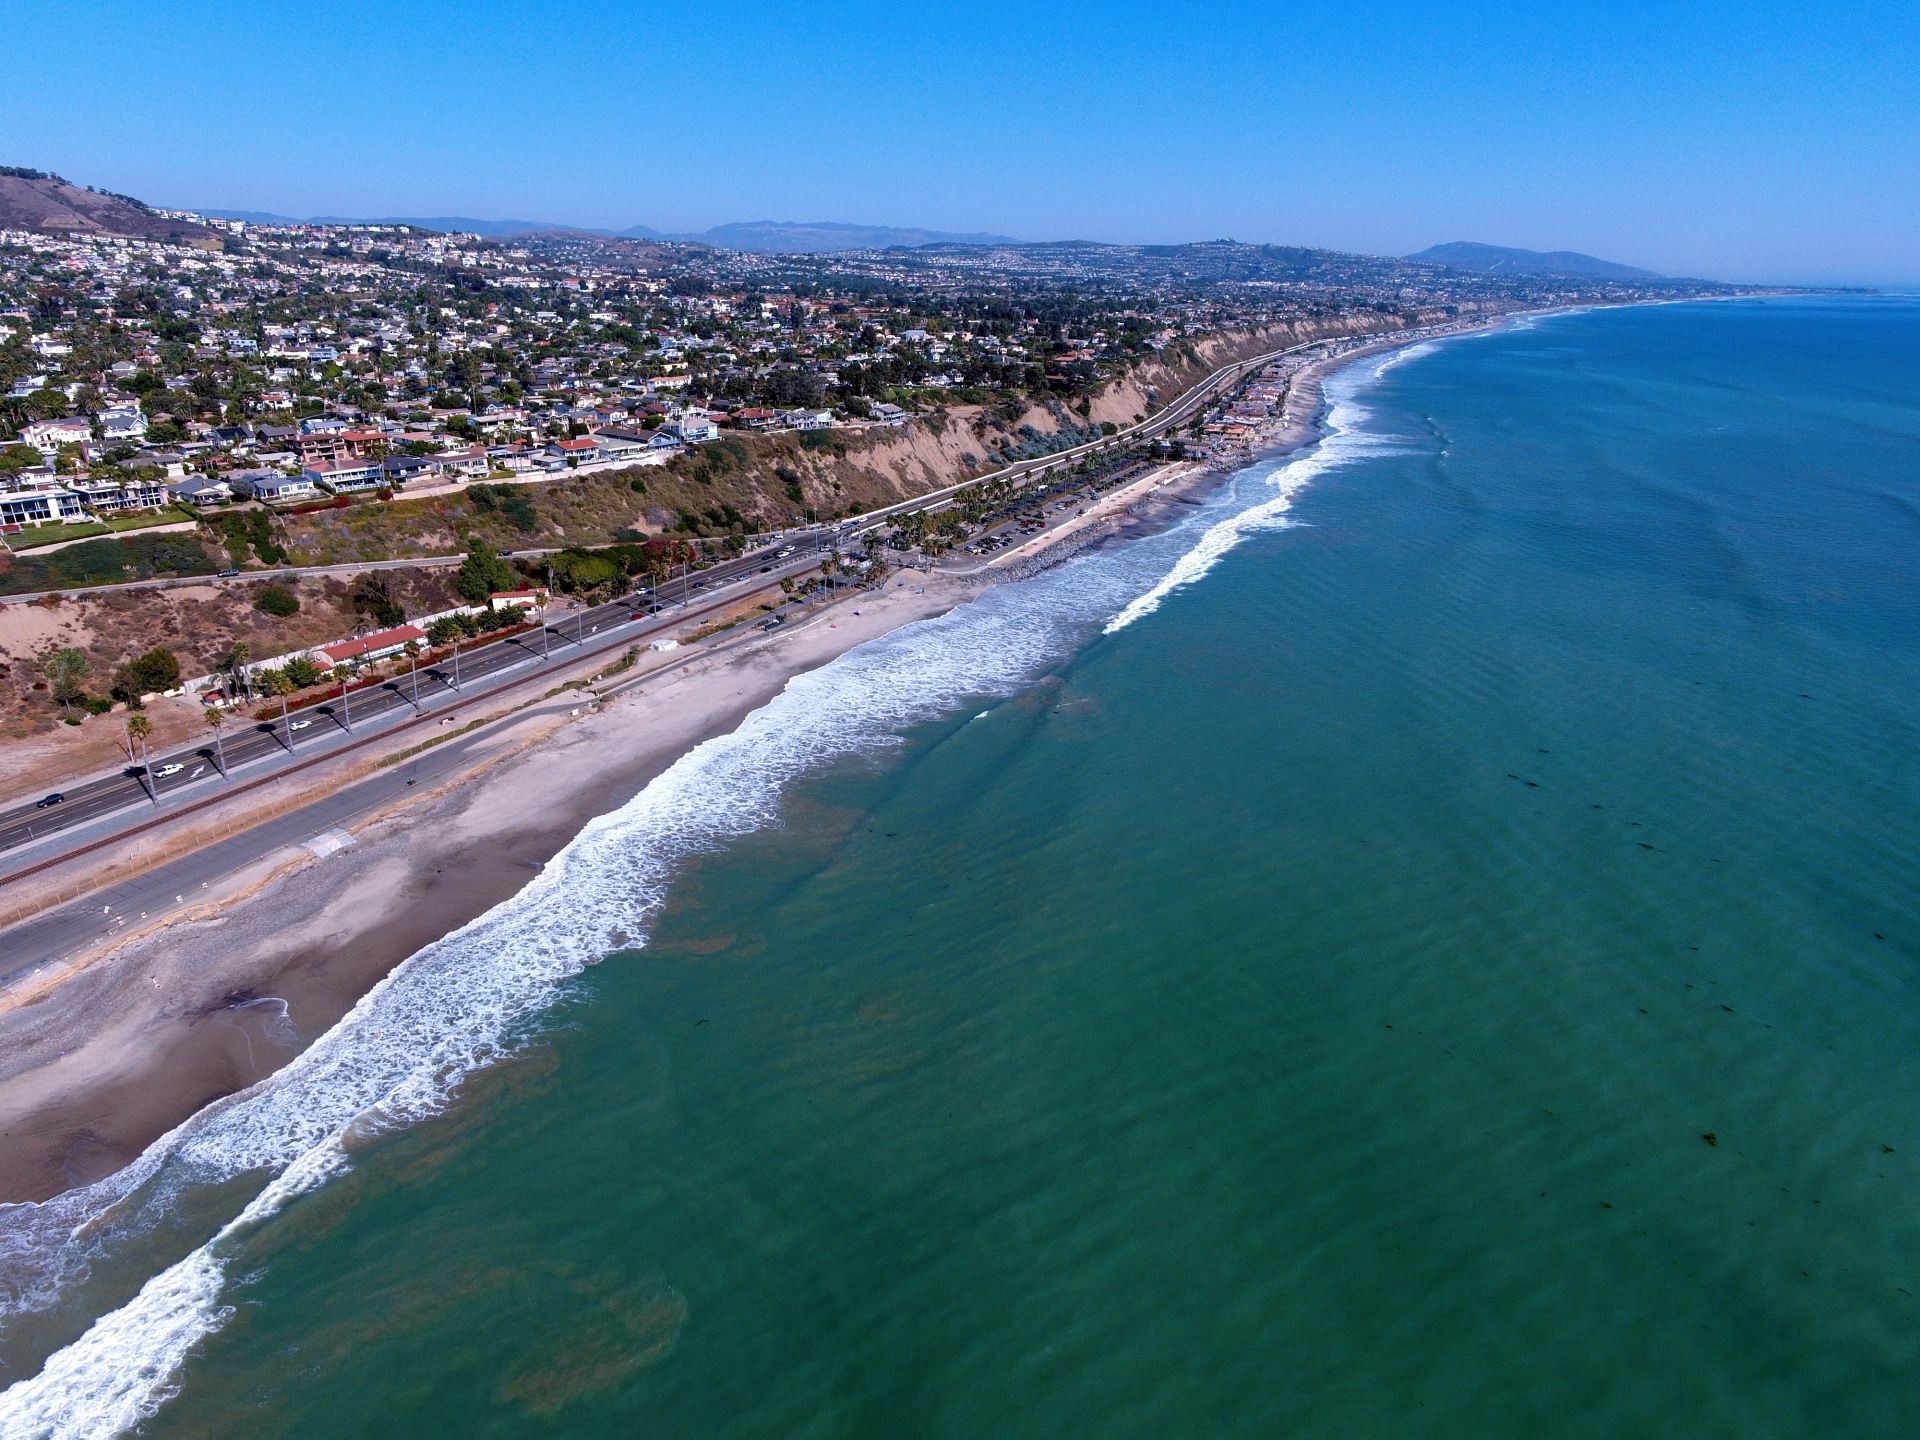
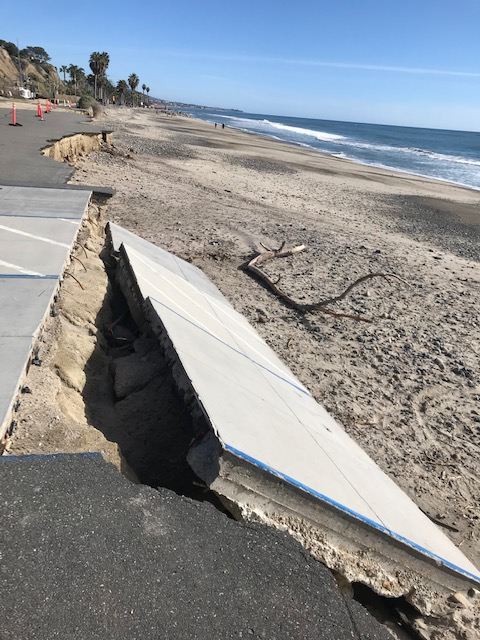
Down in Dana Point, the loss of beach width has resulted in exposure of cobble and rock and damage to State and County beach parks. Monthly drone flights have commenced here to document impacts and quantify the rates of erosion.
Monitoring a Century of Change in Orange County
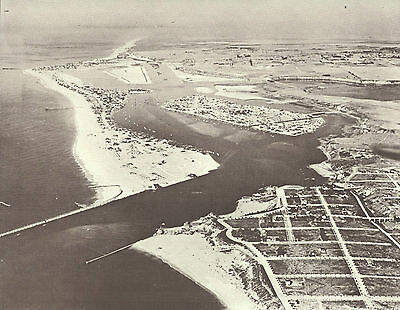
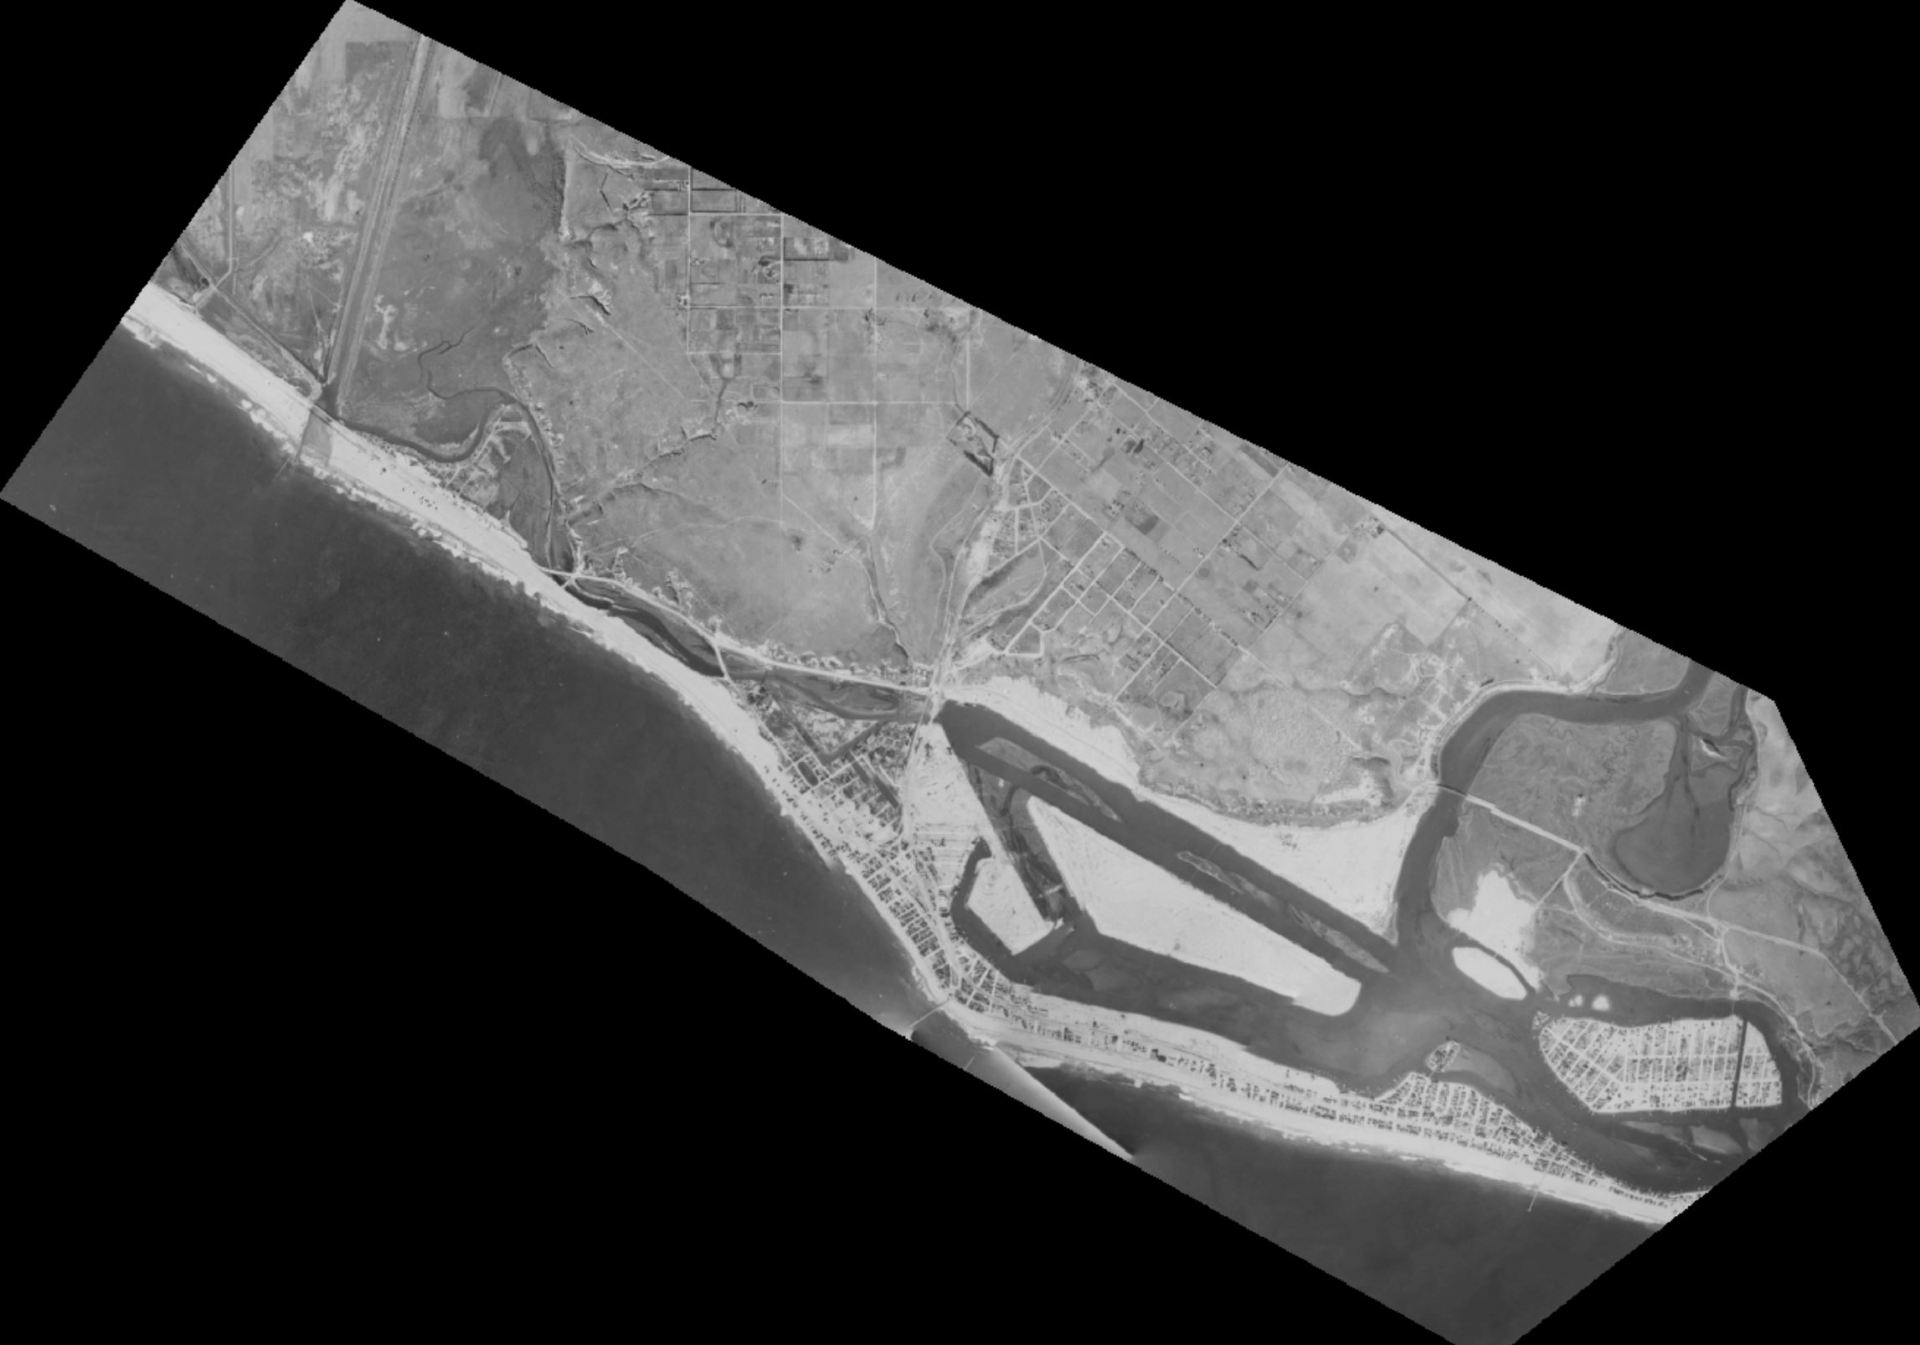
In summer of 2020, high school student Joel Akiyoshi began a project to document a century of change along the Orange County coast based on aerial imagery available from the County of Orange. The County graciously granted him access to georeferenced and digitized aerial imagery dated between 1927 and 2001. An example of aerial imagery from 1927 and 2001 is shown below
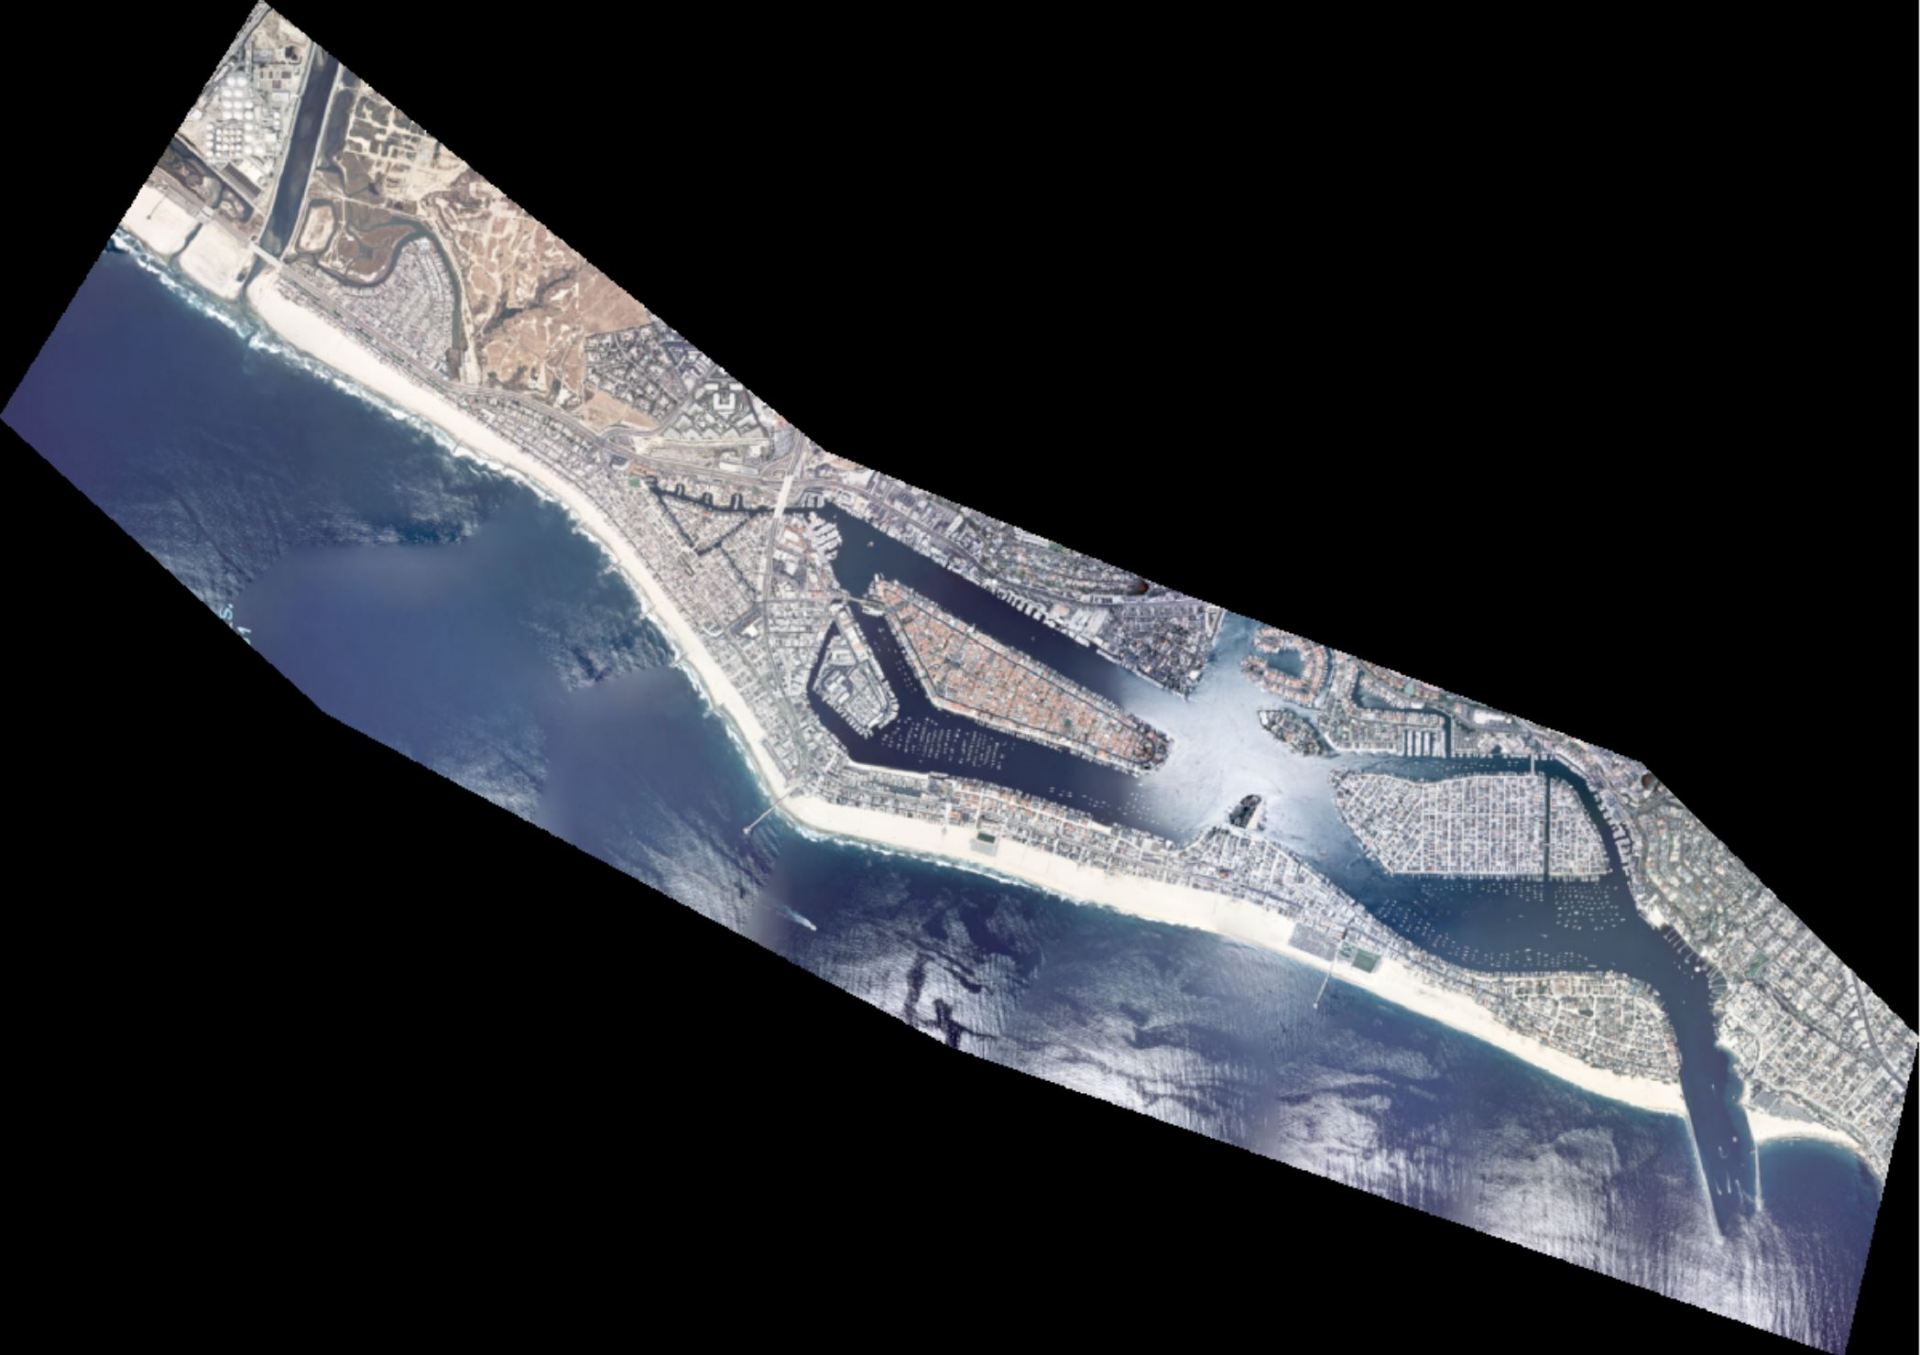
Joel sought to document beach change at a very fine resolution along the coast – transects perpendicular to the coastline spaced roughly 100 m apart where data about wave height, direction, and period is available from the Monitoring and Prediction (MOP) System within the Coastal Data Information Program (CDIP) at Scripps Institution of Oceanography. Due to the density of data and number of images requiring processing, Joel has focused so far on two coastal regions within the Orange County: Newport Beach and Huntington Beach.
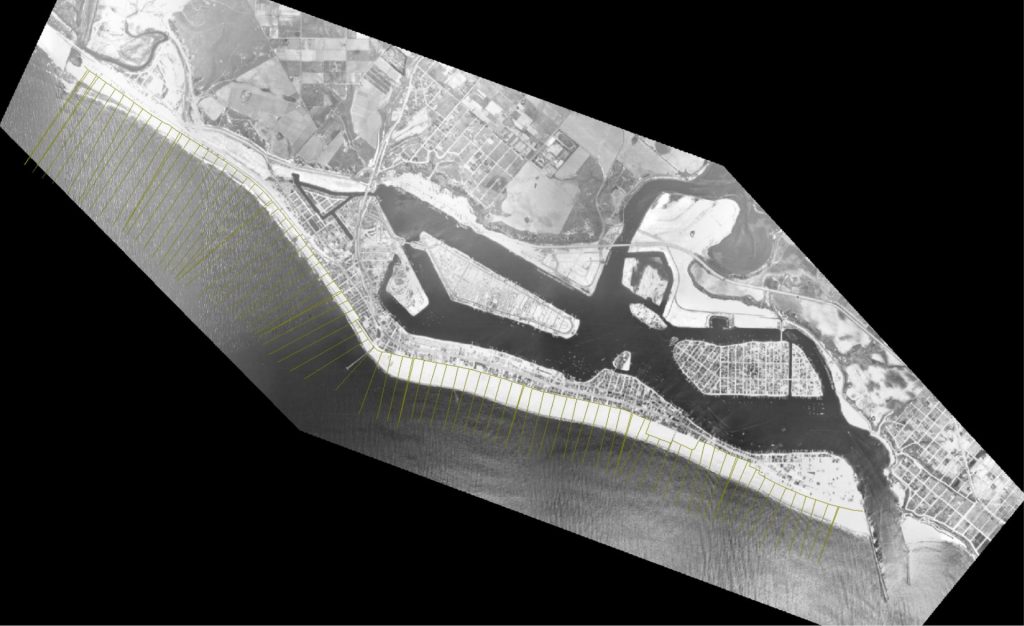
1938 – Transects 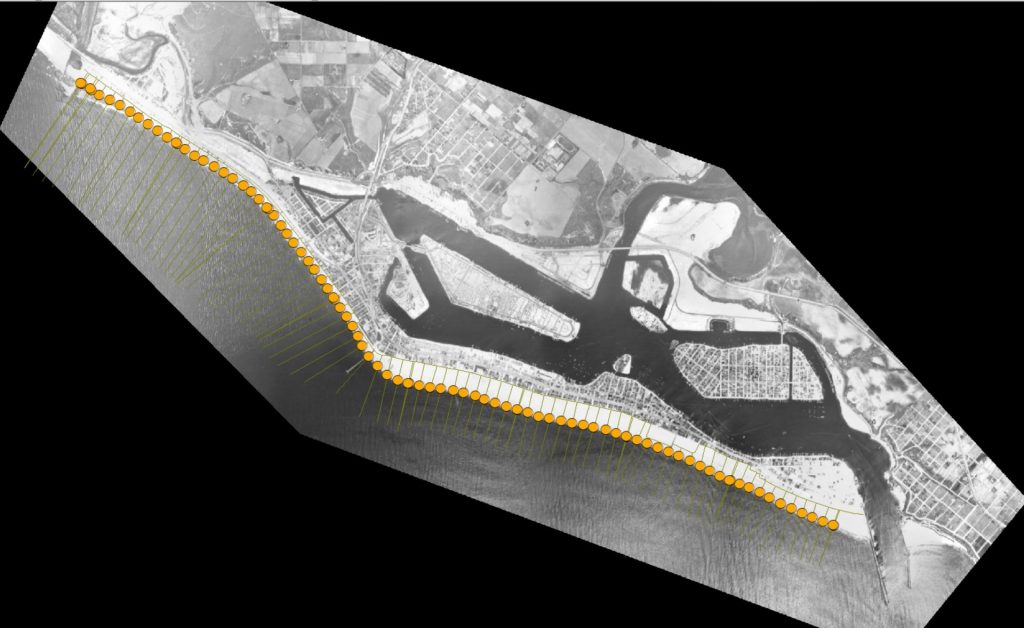
1938 – Points Marked
Trend Analysis: Newport Beach
At Newport Beach, the coastline was divided into nine sections based on coherence in beach width changes, and the average beach width was computed based on the transects contained within each section. The slope in beach width (change in beach width versus time) was computed for each section by least-squares fitting of a linear model and the beach was classified according to the rating system developed by Jenna Kim and Gwen Sanders. Green color indicators a positive trend, yellow indicates no change or a slight decline in beach width, and red indicates a negative trend.
Generally, the west-facing beaches between the Santa Ana River and Newport Pier have experienced an increase in beach width over the past century, while the south-facing beaches between Newport Pier and the Newport Harbor entrance have experience a decline in beach width.
During the 1940s and 50s, west facing beaches had experienced significant declines in beach width which were addressed with the construction of a groin field in the 1960s – a series of structures made from rock revetment aligned perpendicular to the coast.
The groin field had a significant effect on the width of west-facing beaches, effectively reversing the beach loss trend; on south facing beaches, trends in beach width appear similar before and after construction of the groin field. (A word of caution here that groin fields are not a panacea for beach erosion, and a full examination of the advantages and drawbacks of groin fields as well as other coastal protection measures is very important but well beyond the scope of this post).
Trend Analysis: Huntington Beach
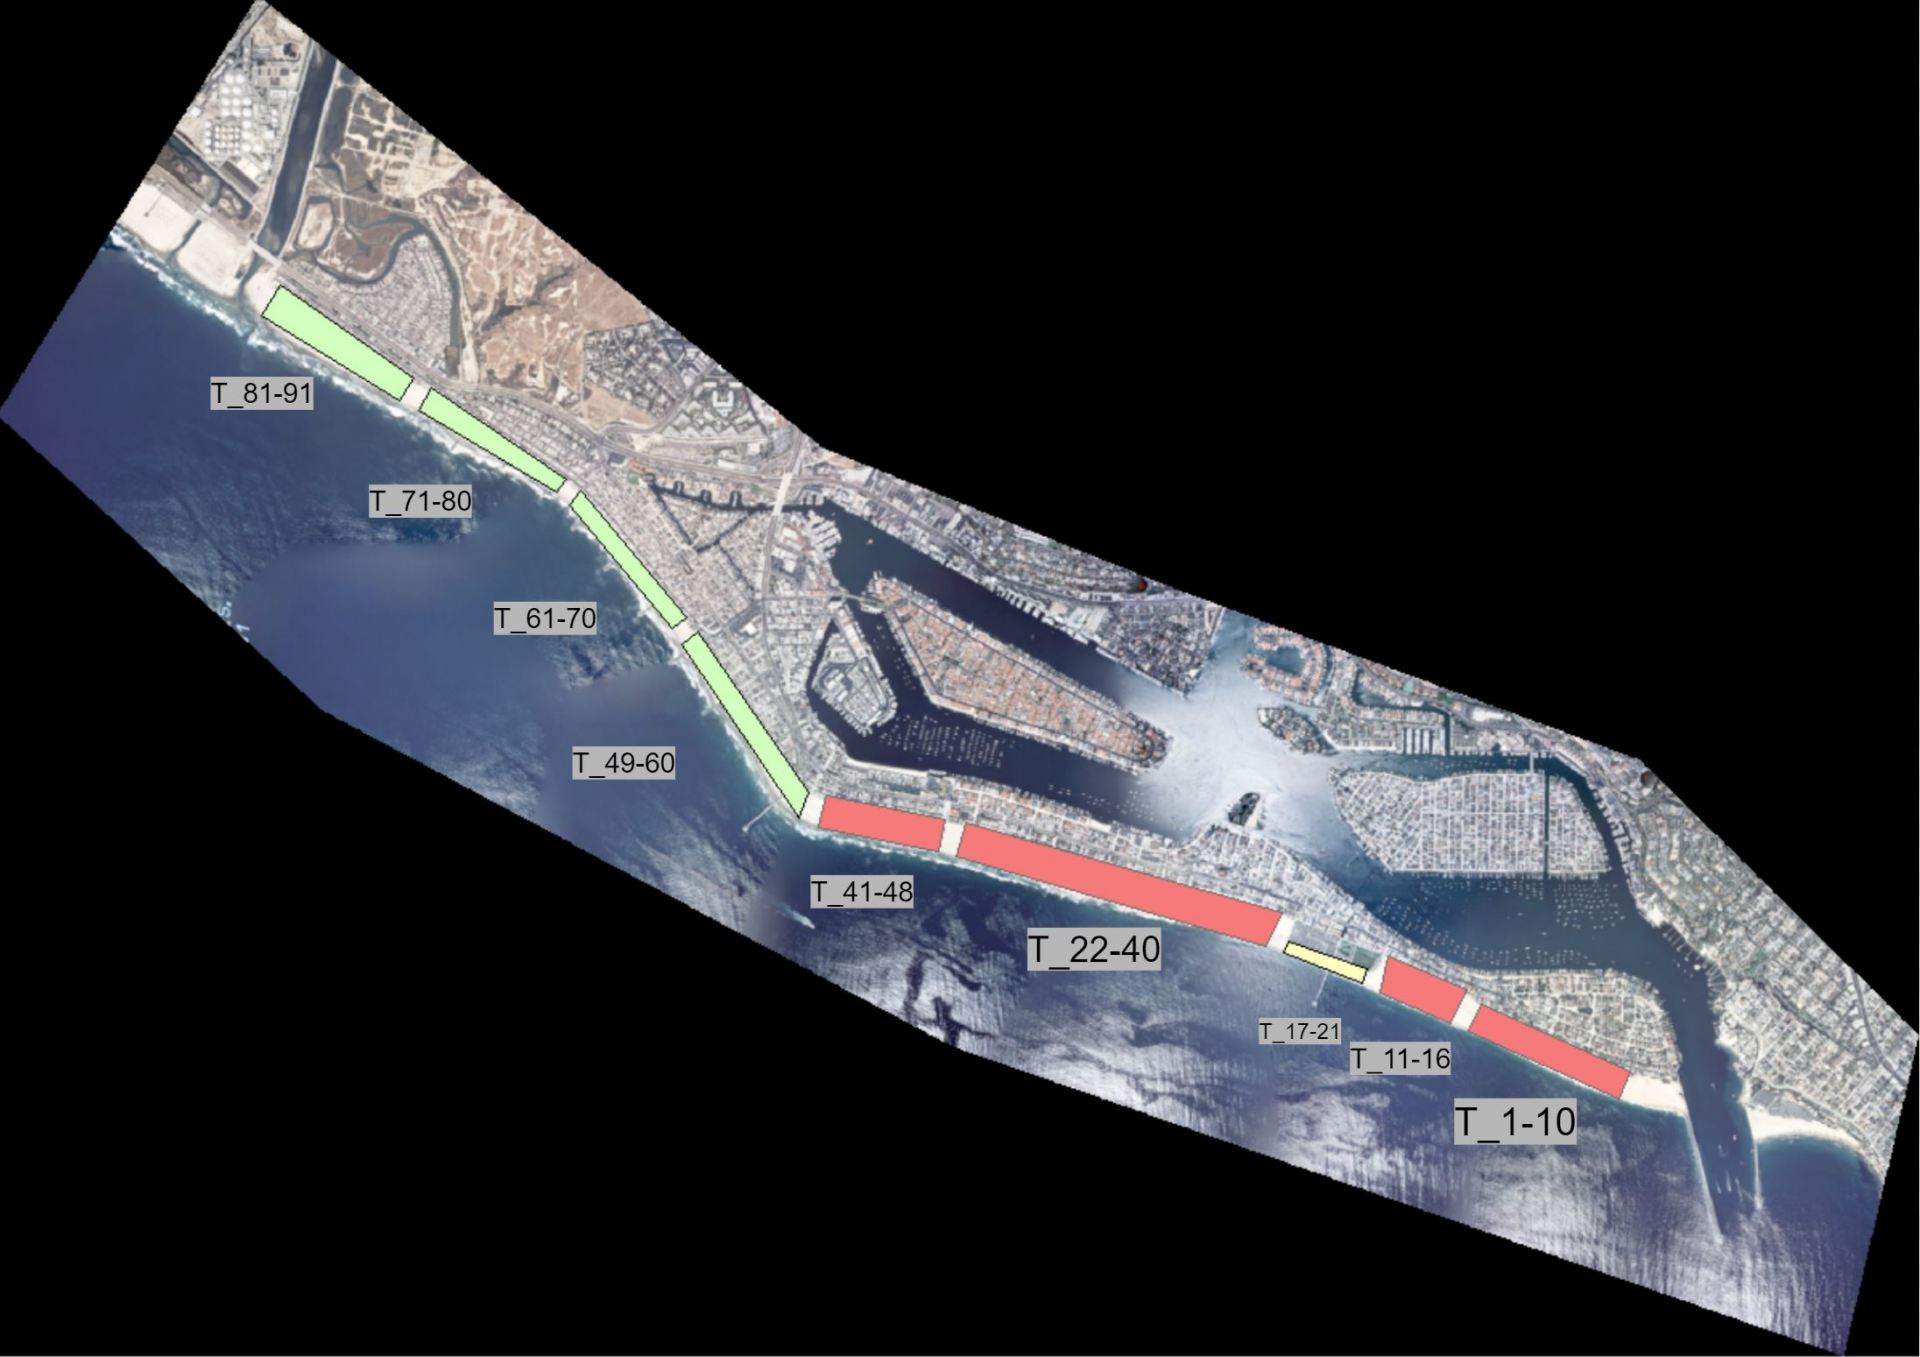
At Huntington Beach, the coastline was divided into nine sections based on coherence in beach width changes and trends were computed based on the average of the beach width across transects within each section.

With the exception of the beach transects 71-80 (located between Golden West St. and Seapoint St.), Huntington Beach has experienced a positive beach with trend over the past century. Between Huntington Pier and the Santa Ana River, the beaches have been growing at a rate of 1-2 m/year on average over the past century.
Trend Analysis: Doheny and Capistrano Beaches
(Forthcoming)